
Gold defended $1,280, launched above $1,300
Gold successfully defended the $1,280 support level and avoided breakout below the support level. At the end of the previous month, the price bounced from $1,280 and rallying to close the month above $1,300 in just two days rally. The rally confirmed bullish reversal in the precious metal and traders suggested to avoid short positions for now, at least until the upward momentum recede.
Fundamentally, we have a breakdown between the U.S and China in trade talk and the tension intensifying. The current rally in gold caused by the market fear on tariff toward Mexico import at the end of the previous week. President Trump announced the plan to slap 5% tariff toward Mexico import and ready to raise it to 25% if the country could not stop migrants from crossing into the U.S.

Click here to see Gold May 2019 forecast.
New Month
Monthly Chart
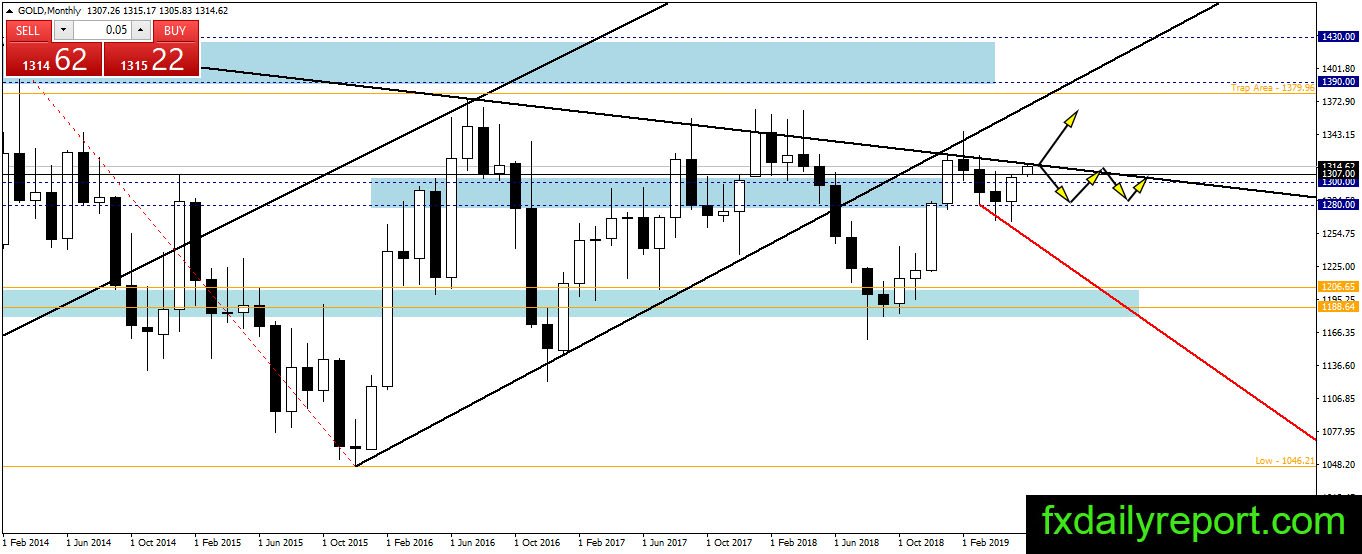
Gold building up bullish pressure after three bearish months. The precious metal closed above $1,300 handle and set to challenge the bearish trendline on the chart. If the price could surpass the resistance and closed above it then we might see gold rallying toward $1,390 – $1,400.
Weekly Chart
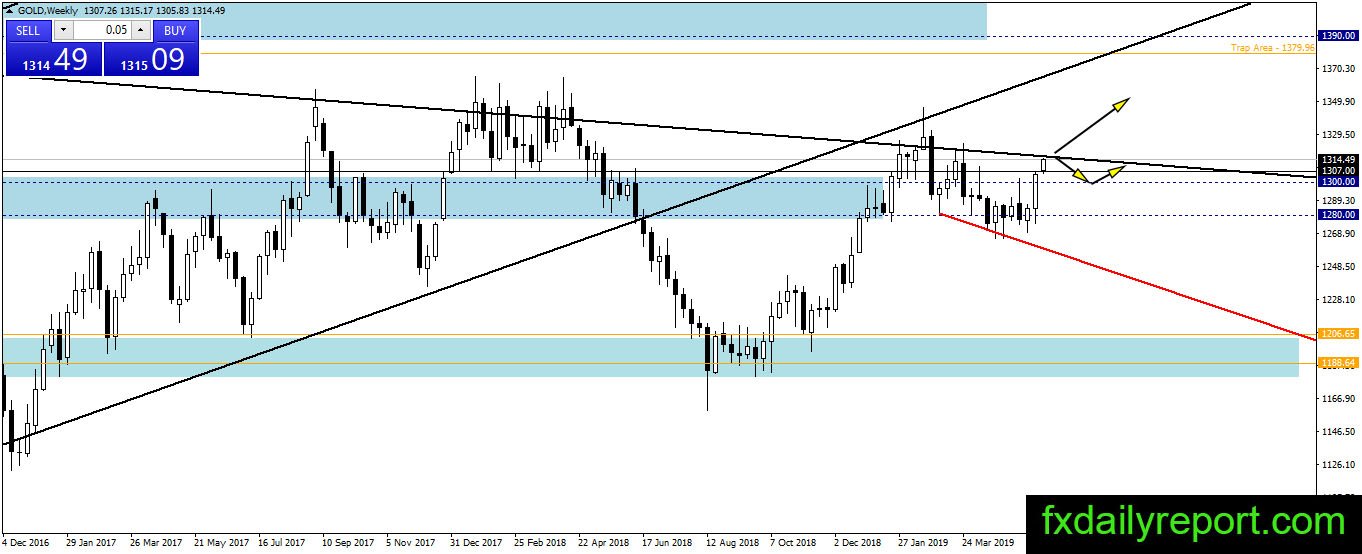
Gold $1,280 support level played a major role in the current bullish rally. The price launched in the previous week and closed above $1,300. There is follow-through by the bull this week and we will see a test on the trendline soon. Will a breakout or rejection happen at the trendlines?
At the current time, the bullish pressure has more power and we might see a breakout.
Daily Chart
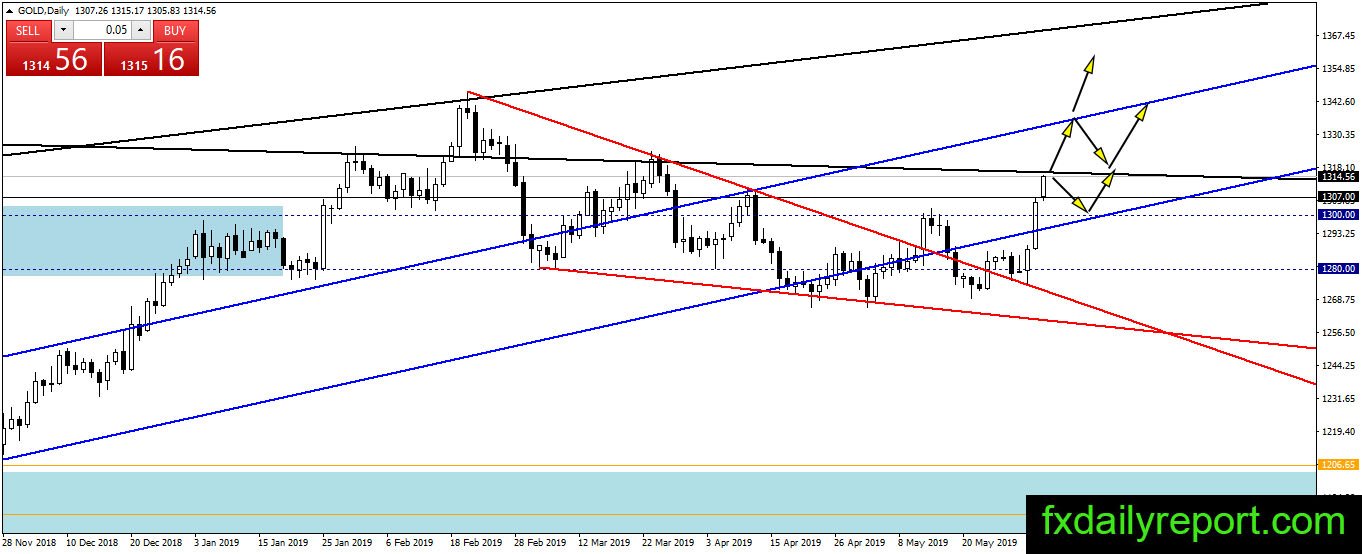
On the daily chart, the odds for bullish continuation gets higher and we have strong bullish momentum. If a bearish correction happens then traders could use $1,300 and $1,307 as the level to look for long positions.
Trade Plan
Bullish trade – A bearish correction toward $1,300 and $1,307 is the opportunity for traders to look for long positions. Without any correction, it will be hard for placing medium-long-term positions.
Bearish trade – Gold is testing the bearish trendline on the monthly chart, bearish trade from the trendline might be the plan traders could take. But it is better to wait until a bearish candlestick formed first to ensure the accuracy of bearish trade.