
The USD/JPY currency pair failed to respond to the weak NFP data with the pair remaining tightly pinned in a sideways movement. Unlike other currencies that showed strength against the greenback after Friday’s events, the pair pulled back only momentarily before stabilizing within the current trading range of (107.875-108.524).
On a bigger picture, the USD/JPY currency pair continues to experience a short-term bearish bias with the current short-term consolidation setting it up for a potential breakout.
USD/JPY Fundamentals Overview

Last week, President Trump’s tweets about levying Mexican imports into the US shook the market in the process adding pressure to the current bearish run in the USD/JPY pair. And this week, it looks like the weak Jobs data will drive the bearish bias again into next week.
The US Job market created 75k jobs in MaY, which came short of expectations of 185k jobs. And to add fuel to the fire, wage growth slowed to 3.1 on a year-over-year basis compared to April’s growth of 3.2% and a forecast of 3.2%.
However, with the unemployment rate remaining flat at 3.6%, it looks like the disappointment could be only short-term with a potential rebound expected this month.
USD/JPY Technical Analysis (the 60-min Chart)
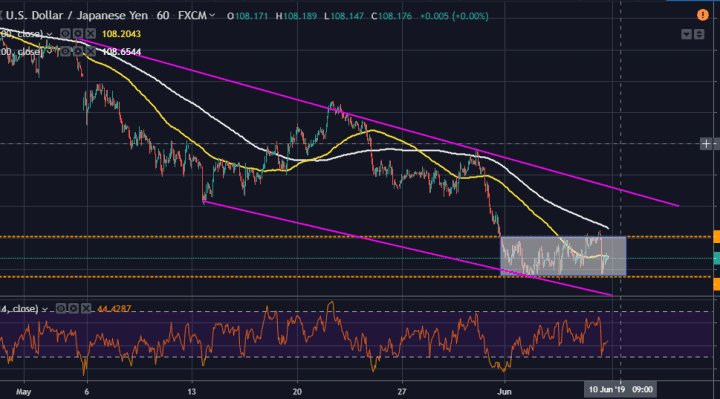
From a technical perspective, the USD/JPY currency pair is currently pegged just below the 100-hour moving average line in the 60-min chart.
The 200-hour MA line is a few pips above the current resistance level while the RSI down below shows that there is a lot of room to run above than there is below. This supports the short-term bullish case as the greenback looks to rebound against the Yen.
As such, the bulls will be targeting profits at around 108.524 in the short-term while the bears will look to pounce by targeting profits at 107.875.
USD/JPY Technical Analysis (the Daily Chart)
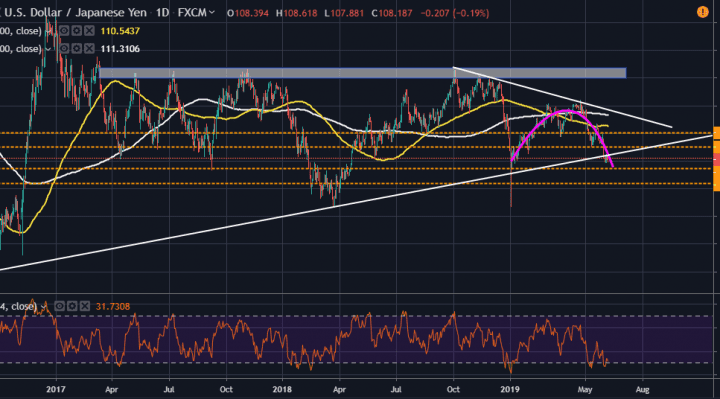
In the daily chart, the pair appears to be trading within an ascending wedge, which dates back to late 2016. The USD/JPY also enjoys strong trendline support, which has remained firm for more than two years.
However, right towards the end of this wedge, the pair appears to be forming a convergence, which could suggest a potential consolidation that could trigger a breakout from the wedge. This creates multiple trading opportunities for both sets of traders as demonstrated in the chart.
In summary, with the pair trading on the edge of the oversold zone in the RSI indicator, the bulls could claim control in the short-term. However, the immediate future after that remains highly unpredictable given the current consolidative pattern formation.