
Gold ease after trade truce, more potential upside on possible new trade war
Gold successfully defended the $1,280 support level and avoided breakout below the support level. In the previous month, we have rallied from $1,305 to as high as $1,438. The situation mostly influenced by U.S-China trade war development and The Fed FOMC meeting.
In the previous FOMC meeting, the Fed sounded dovish and hinted for rate-cut in the next meeting. The market now 100% think the Fed will lower rate in the next meeting. At the end of the month, we have trade truce between U.S and China which lower the fear thus lower gold prices. However, a new trade war between the U.S and EU is looming. Gold start climbing again at the current time. It seems the precious metal still has more room upside.

Click here to see Gold June 2019 forecast.
New Month
Monthly Chart
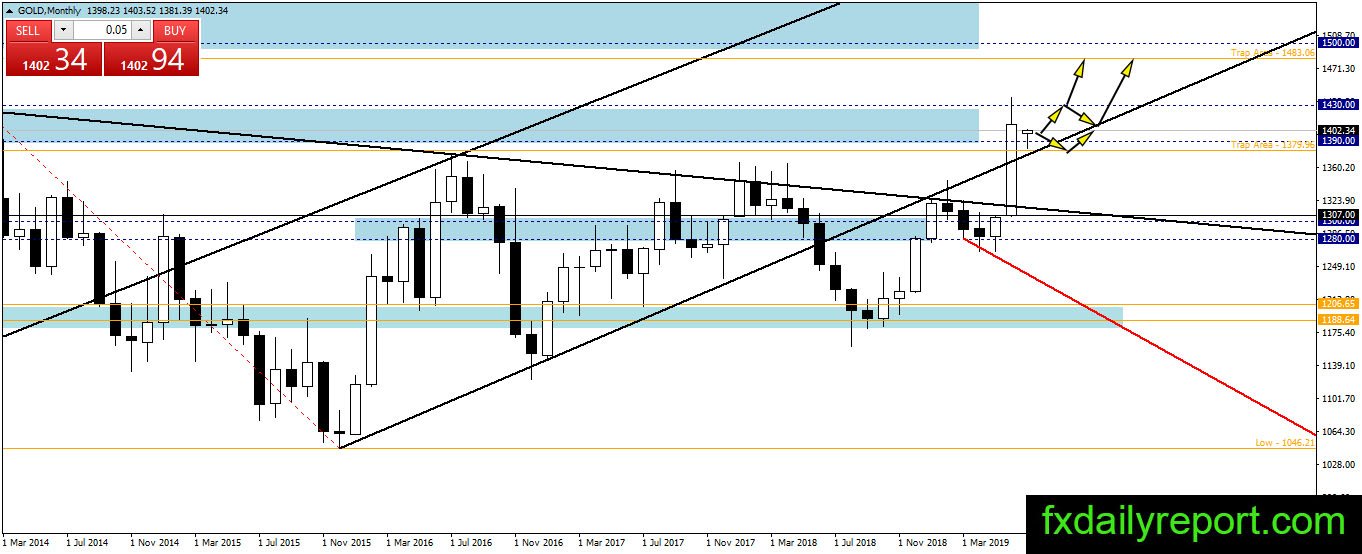
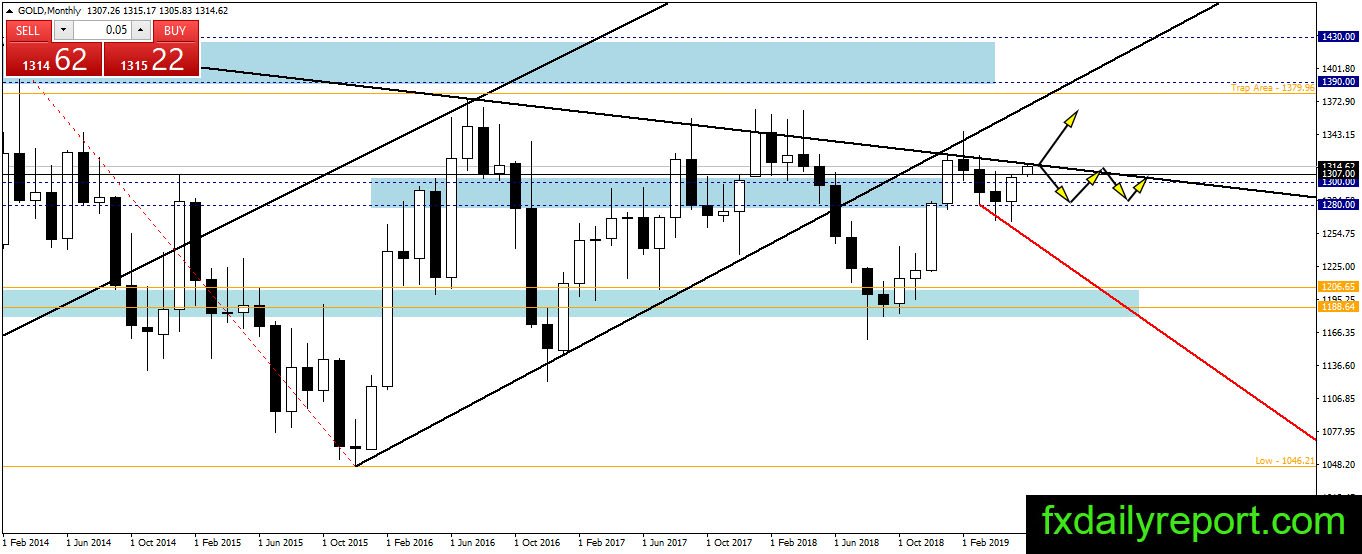
Gold finally breaks loose above the trendline and launched toward $1,390 – $1,400 resistance area as expected. The upward momentum is strong and manages to close above $1,400 in the previous month. At the current time, the prices consolidating above $1,390 and waiting for a bullish follow-up.
Weekly Chart
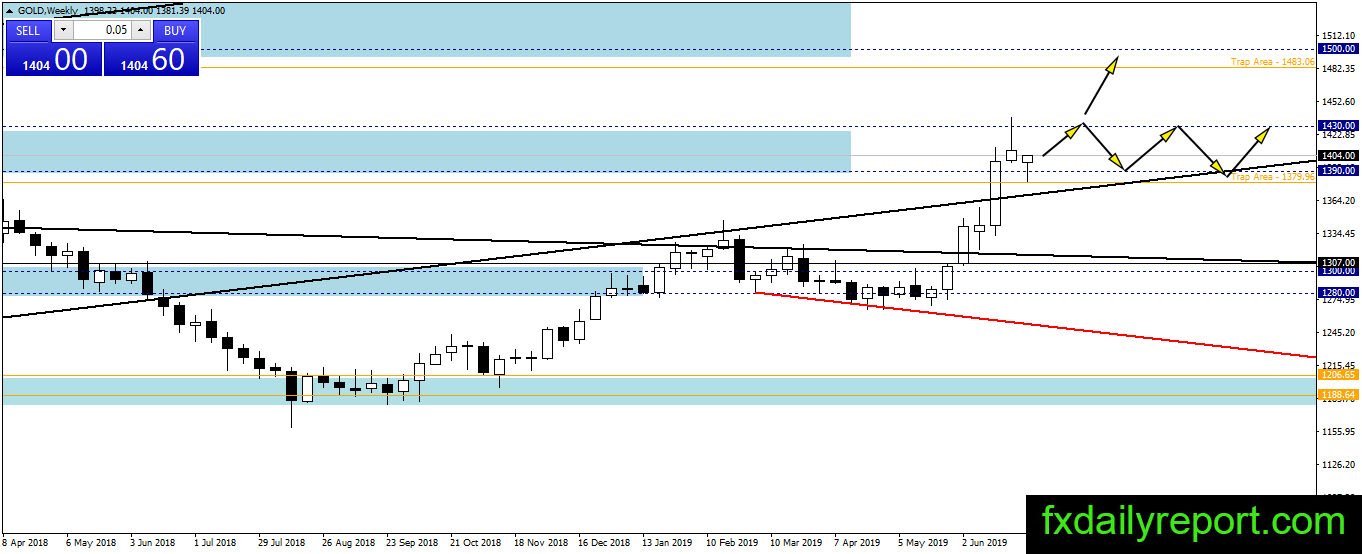
Gold bullish pressure brought the precious metal to test $1,430 resistance level before turned lower. We have a bounce from $1,390 this week and the price might move between $1,390 – $1,430 now. Traders could use the moment to trade the range with bullish bias until breakout happens.
Daily Chart
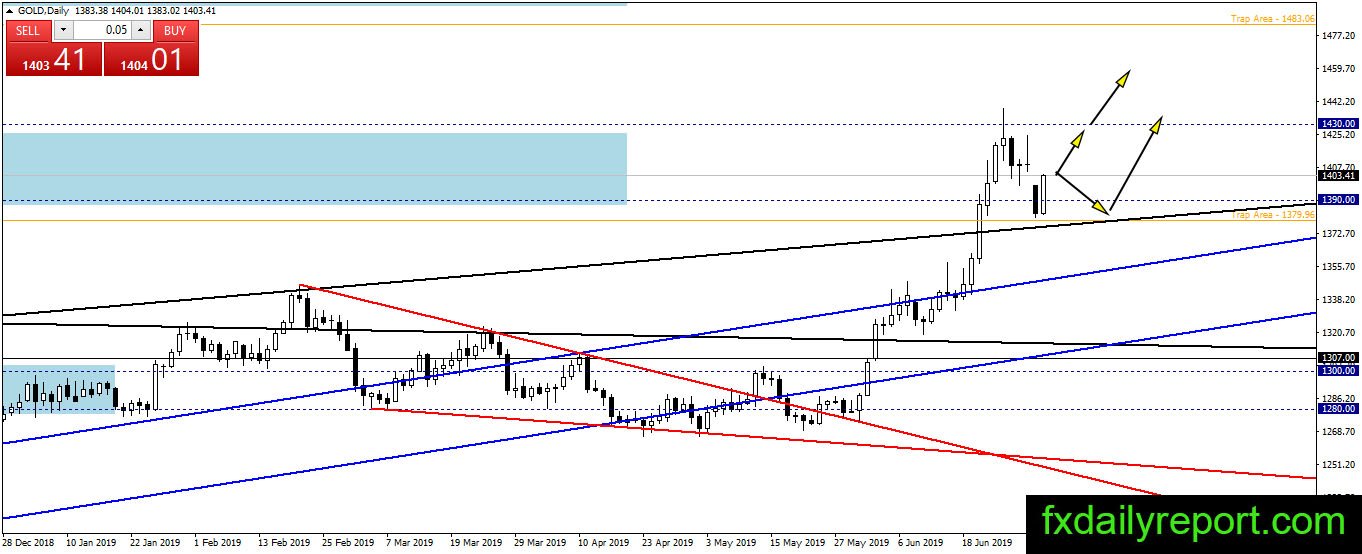
The bull showed its dominance on the daily chart. Bearish pressure at the start of the week caused by trade truce between U.S and China immediately erased by the bounce from the support level. (Note: New trade war between U.S-EU is brewing). We could expect gold to continue upward and test $1,430.
Trade Plan
Bullish trade – A bearish correction toward $1,390 is the opportunity for traders to look for long positions.
Bearish trade – Wait until the price tested $1,430 and formed strong bearish pattern before placing short positions. Short from $1,430 has $1,390 – $1,400 as target.