
EUR/GBP long-term technical analysis
Brexit deadline is ticking and the UK might leave Eurogroup without any deal. Both Euro and Pound sterling might become the losing party in the global market board. At the end, who will get the most damage after the separation?
Traders and investor might prepare for surprise nearing the Brexit deadline. Extension, political unrest, a sudden deal could happen at the last minute. Currently, traders and investors will watch the Fed interest-rate decision as ECB has lower deposit rates and announce massive bond-buying program last week.

Click here to read previous EUR/GBP long-term technical analysis
New Month
Monthly chart

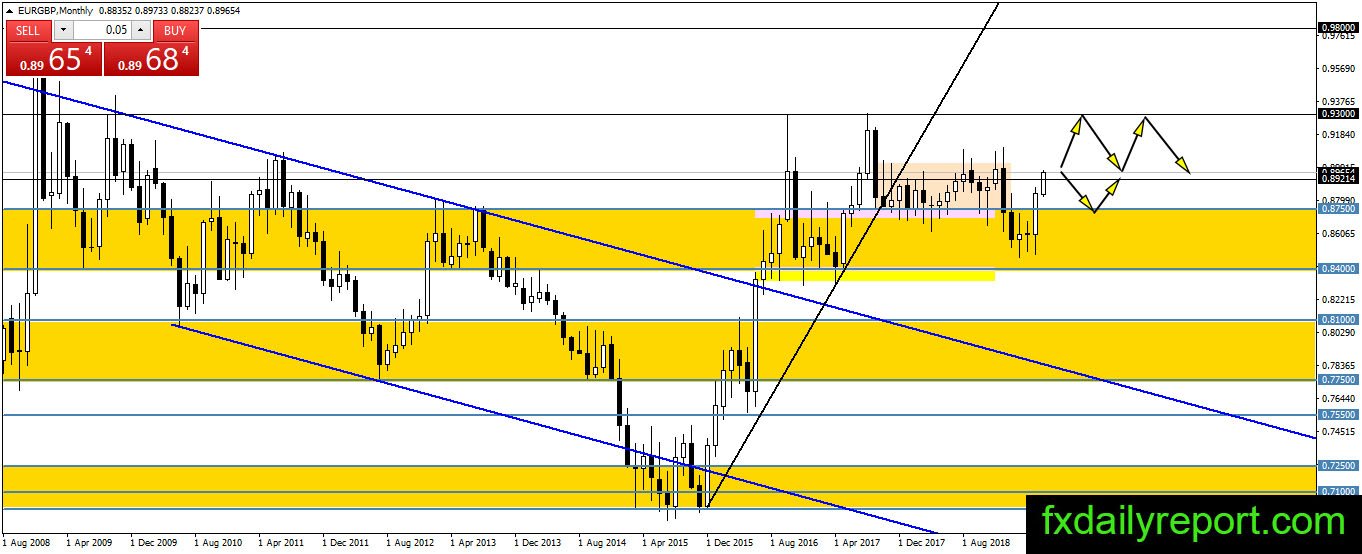
EUR/GBP “magically” or technically reversed when it hit 0.9300 resistance. The pair formed a major bearish pin bar pattern which gave traders clue to enter short positions. This month, the pair tumble below the bearish pin bar pattern low and trigger sell-off. Without any change in the direction, EUR/GBP might reach 0.8750 soon.
Weekly chart
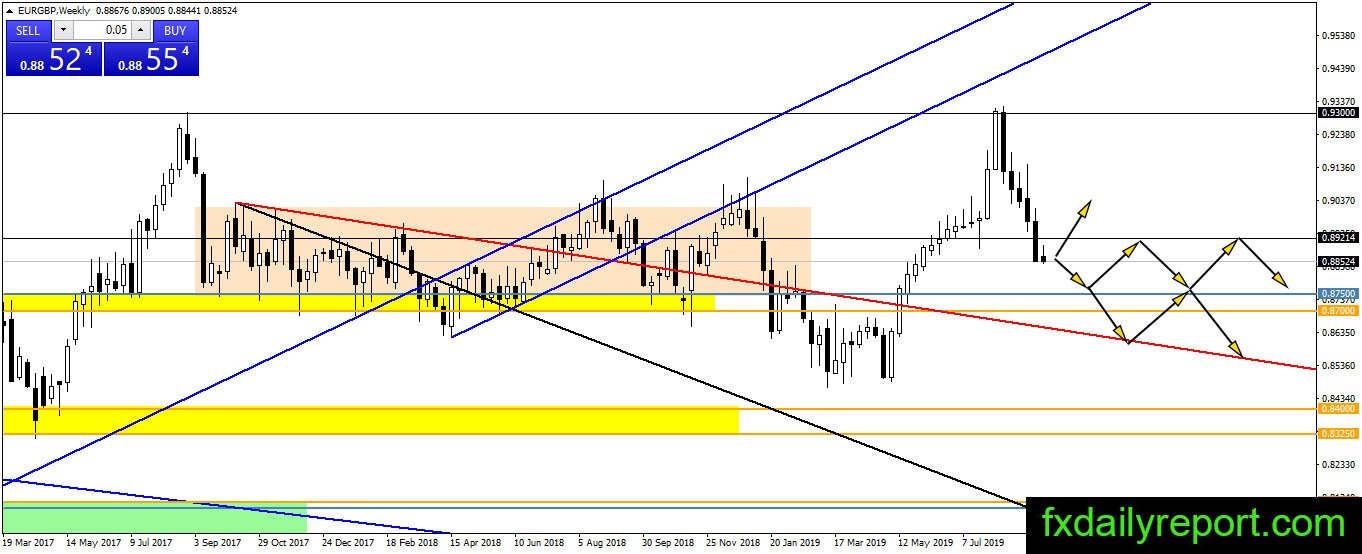
This week is the major week to watch for traders in EUR/GBP. On the weekly chart, we have breakout below 0.8920 support level and the pair gathering bearish momentum to move further lower. If the bull could close the pair above 0.8920 then the bullish trend will restart. On the other hand, further bearish close is the confirmation that the pair will reach 0.8750.
Daily chart

A lower low on the daily chart is not a good sign for the continuation of the bullish trend. However, the current situation is driven by major event by ECB and Brexit event which could change anytime. Tomorrow the Fed will decide interest-rate which also could change the direction of EUR/GBP.
Technically, we expect the pair move further lower toward 0.8750 before it could change direction.
Trade plan
Long strategy: The pair could move further lower toward 0.8750 after the breakout below 0.8920. Long position near 0.8920 is the option traders could take. Adding more long positions near 0.8750 is another strategy to consider. On the daily chart, there is bullish trendline which traders could use as a stop level.
Short strategy: Short near 0.8920 for short-medium-term is the option traders could take.
Traders might want to be cautious nearing Brexit deadline.