
The price of the WTI Crude Oil on Friday pulled off 3-month highs to bottom below the key level $60.00 bringing an end to 20 days of ascension. The oil price has been on a bullish run since the beginning of the month.
The light crude oil is now pegged between the 100-hour and the 200-hour SMA lines in the 60-min chart, which suggests that the current trend could continue for the next few days. The oil price has also bounced off oversold levels, which entered earlier today after the pullback.
WTI Crude Oil Fundamentals Overview

From a fundamental perspective, the price of WTI Crude Oil is trading at the back of a busy period in the oil market. This week was the first full week of Saudi Aramco trading at the Tadawul stock exchange. The world’s largest company by market capitalization has boosted oil prices after it surged more than 10% following the IPO.
On Friday, the US GDPPI for Q3 missed the expectation of 1.8% with 1.7% adding more pressure to the price of light crude oil. This came at the back of another round of disappointing crude oil stock changes. Earlier in the week, the API WTI Crude Oil stocks edged higher to 4.7M up from 1.41M barrels in the previous week.
The EIA WTI Crude Oil stocks change also missed the expectation of -1.288 with -1.085 while the Baker Hughes Oil Rig Count edged lower to 664 down from 667. The EIA Natural Gas Storage Change of -107B was also better than the expected change of -90B.
WTI Crude Oil Technical Analysis (the 60-min Chart)
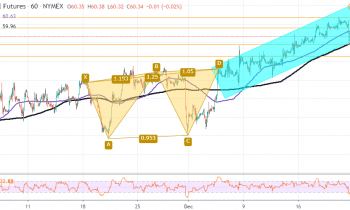
Technically, the light crude oil price appears to have recently bounced off oversold levels following Friday’s late rebound. The oil price is now pegged between the 100-hour SMA and the 200-hour SMA with slight bearish pressure in an ascending channel.
Therefore, the bulls will be targeting long-term profits at around $60.79 or higher at $61.36 while the bears will hope for a continuation of the pullback towards $59.90 or lower at $59.29.
WTI Crude Oil Technical Analysis (the Daily Chart)
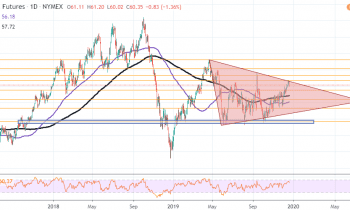
In the daily chart, the price of oil appears to be trading within a consolidative symmetrical triangle. It has recently touched the trendline resistance up top which triggered today’s pullback and this could result in a major downward movement in the next few days.
Therefore, the bears will be targeting long-term profits at around $59.00, $56.87, or lower at $54.70. On the other hand, the bulls will hope that the light crude oil price breaches the trendline resistance to advance towards $61.43, $62.66, or higher at $64.38.