
The US Dollar Index (DXY) on Friday plunged from 97.10 to about 96.75 where it found support at the 100-hour SMA after US data. The USDX has been on a bullish run since forming a double-bottom XABCD pattern late last month that was completed two days ago.
However, that run came to a premature end on Friday after the latest US ISM Manufacturing PMI missed expectations. The Dollar Index has since pulled off overbought levels to trade within the normal trading zone of the RSI indicator in the 60-min chart.
The US Dollar Index Fundamentals Overview

From a fundamental perspective, the US Dollar Index is trading at the back of a relatively quiet week in the US market. There was less activity in terms of economic data with the key events happening on Friday. The escalation of the US-Iran tensions is also affecting markets, which could be part of the reason why the Dollar Index plunged on Friday before finding support.
On Friday, the US ISM Manufacturing PMI for December missed the expectation of 49 with 47.2 after edging lower from the previous month’s reading of 48.1. The ISM Prices Paid for the same month beat the expectation of 47.5 with 51.7. On the other hand, the ISM -NY Business Conditions Index edged lower to 39.1 down from 50.4 in the previous month.
On Thursday, the US jobless claims for the week ending December 27 beat the expectation of 225k with 222k while the continuing claims for the preceding week missed 1.719M with 1.728M. The Markit Manufacturing PMI also failed to meet the consensus estimate earlier in the week.
The US Dollar Index Technical Analysis (the 60-min Chart)
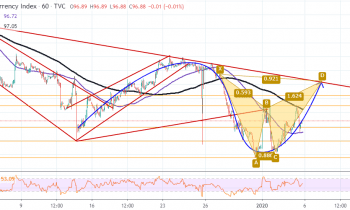
Technically, the USDX appears to be on course to complete recovery from the post-Christmas plunge. This would be the second attempt in as many days, but the late pullback appears to have put the rally on hold. Nonetheless, with the non-farm payrolls coming in next week, the bulls might yet stay optimistic.
They will be targeting short-term profits at around 97.10 or higher at 97.25 going into next week. On the other hand, the bears will look to pounce for profits at around 96.79, 96.59, or lower at 96.35.
The US Dollar Index Technical Analysis (the Daily Chart)
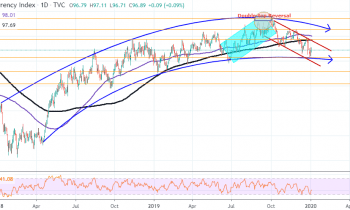
In the daily chart, the DXY still appears to be trading under significant bearish pressure in a descending channel off a relatively bearish curve. The Dollar Index has recently bounced off the boundary to the oversold levels after a rebound. However, the bears remain in control of the long-term markets.
Therefore, they will be targeting long-term profits at around 96.31, 95.15 or lower at 94.17. On the other hand, the bulls will target profits at around 97.73, 98.52, or higher at 99.43.