
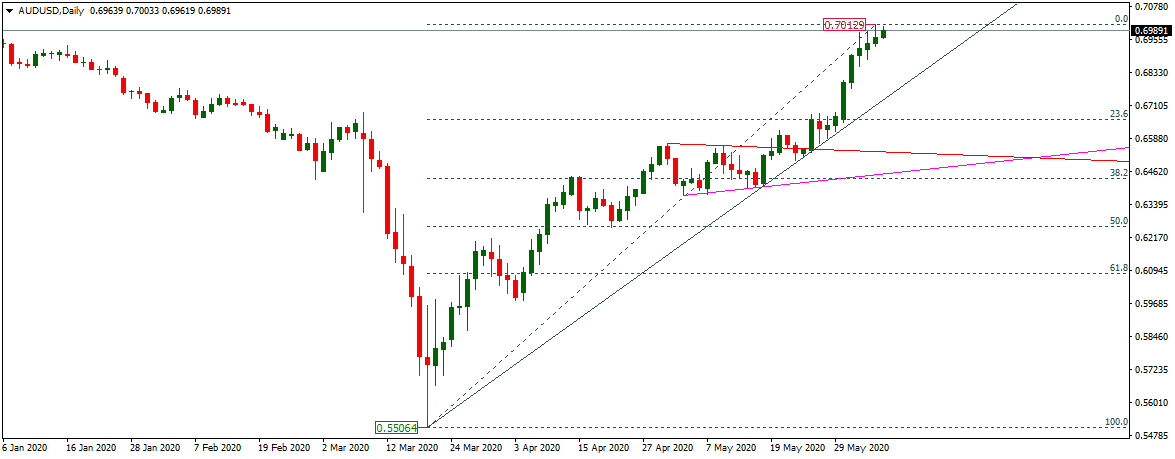
The AUDUSD started high this week marking the bullish candle on the very first day of trading, it managed to escalate upward after hitting the highest of December 13, 2019 (the optimal point in AUDUSD history), i.e. 0.6960. In the coming weeks, the technical bias seems to remain bullish as the higher high was printed by the price during the last upside move.
As of this writing, the pair is being exchanged for 0.6991, and its good that with no resistance levels coming ahead. the release of the Trade balance report this month turned out to be higher than that of the economist anticipated. It remained 8800 M as compared to 7500 M the economist anticipated, however, it below from the previous monthly report which was 10446 M.

Trade Balance provides an early indication of net export output. If a constant production is seen in exchange for Australian exports, that would turn into a positive trade balance growth and that should be positive for the AUD.
The retail sales also showed an optimistic response compared to the economist ‘s forecast and the last month’s index by rising by 2%. Retail Sales released by the Australian Statistics Bureau is a survey of goods sold by retailers based on a sampling of retail stores of various types and sizes and is considered an indicator of the Aust ‘s pace.
In addition, the AUDUSD is fully supported by multiple support levels, the first immediate support assisted the pair ‘s price at 0.6979, the trend line support, then the Fibonacci level at 0.6443, then the main horizontal support level 0.6269 soon.
Conclusion
Keeping in view the price movement of the pair over the past few weeks, trading the AUDUSD for a long term position would surely bring fruitful results. Those who wish to take short positions may also try their fate for sure.