
The USD/JPY currency pair on Friday continued to trade in a consolidative triangle formation amid a lack of clear directional momentum. The pair is pinned just above the 100-hour and the 200-hour SMA lines in the 60-min chart.
The current pattern formation is forming within a slightly descending channel, which suggests that the bears hold short-term control. However, the base of the triangle appears to be rising while the top part is flatter, which suggests that the bulls could seize control of the pair.
USD/JPY Fundamentals Overview

From a fundamental perspective, the USD/JPY currency pair is trading at the back of a relatively busy period in both markets. Earlier in the week, Japan’s seasonally-adjusted retail sales for July missed the (MoM) expectations of 8% with -3.3%. General retails sales missed the (YoY) expectation of 2.4% with -2.8% while large retailers sales beat -10.5% with -4.2%. On the other hand, preliminary Industrial production for July missed the (YoY) expectation of -15.7% with -16.1%. The unemployment rate for July beat the expectation of 3% with 2.9% up from 2.8% in the previous period.
In the US, the jobs data for August slightly missed the expected count of 1.4 million with 1.37 million new jobs. The average hourly wage growth for the month was up 4.7% (YoY), better than the expected growth of 4.5%. The labor force participation rate also outshone 61.4% with 61.7% while the unemployment rate of 8.4% was way better than the 9.8% predicted. Earlier in the week, the US ISM services PMI for August came short of 57 with 56.7 while the ISM Manufacturing beat 54.5 with 56.
USD/JPY Technical Analysis (the 60-min Chart)
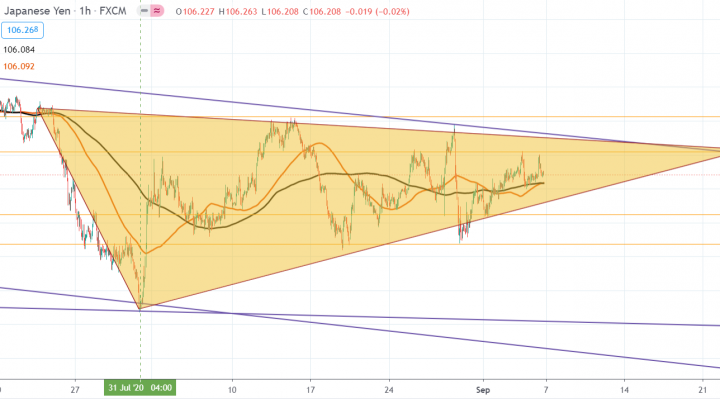
Technically, the USD/JPY currency pair appears to be trading within a consolidative triangle formation in the 60-min chart. This indicates a lack of clear directional bias in the market sentiment.
The bulls will be targeting short-term profits at around 106.544 or higher at 107.067. On the other hand, the bears will look to pounce for profits at around 105.622 or lower at 105.180.
USD/JPY Technical Analysis (the Daily Chart)
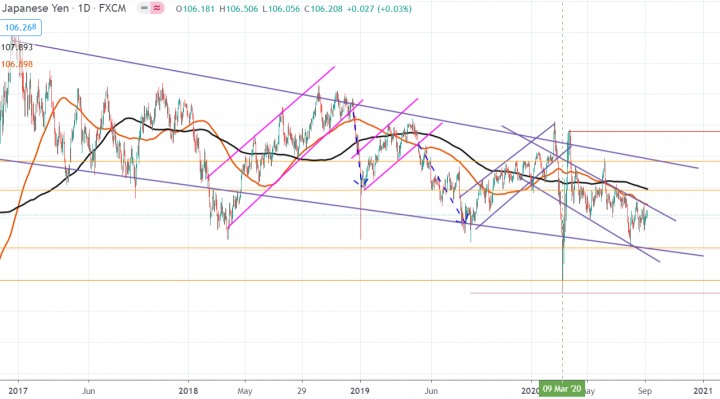
In the daily chart, the USD/JPY currency pair appears to be trading within a descending channel. This indicates a significant long-term bearish pressure in the market sentiment.
He bears will be looking to retain control of the pair by targeting profits at around 104.084 or lower at 101.965. On the other hand, the bulls will look to pounce at around 107.814 or higher at 109.673.