
Bitcoin was under extreme selling pressure on Tuesday as the cryptocurrency briefly plunged below critical technical support of $10,000.
The downside move surfaced against a depressive outlook for safe-havens. Traders preferred to hold their positions in cash as assets like Gold and Bitcoin became too overbought. That led them to correct lower from their year-to-date highs established earlier in August.

Meanwhile, a renewed appetite for the greenback led the US dollar higher against a basket of foreign currencies.
Why $9.2K?
Bitcoin was tracking the US dollar index since March 2020. Any weakness in the greenback raised bids for the cryptocurrency. But after investors assessed the potential of a steady US economic recovery on optimistic jobs and manufacturing data released last week, they reduced their positions in Bitcoin.
That has left the cryptocurrency under a bearish spell. It earlier broke below $10,500, a flipped support that again turned into a resistance. Meanwhile, an extended sell-off led the price near $10,000. BTC/USD is now attempting to hold the level as support against the risks of another downside wave.
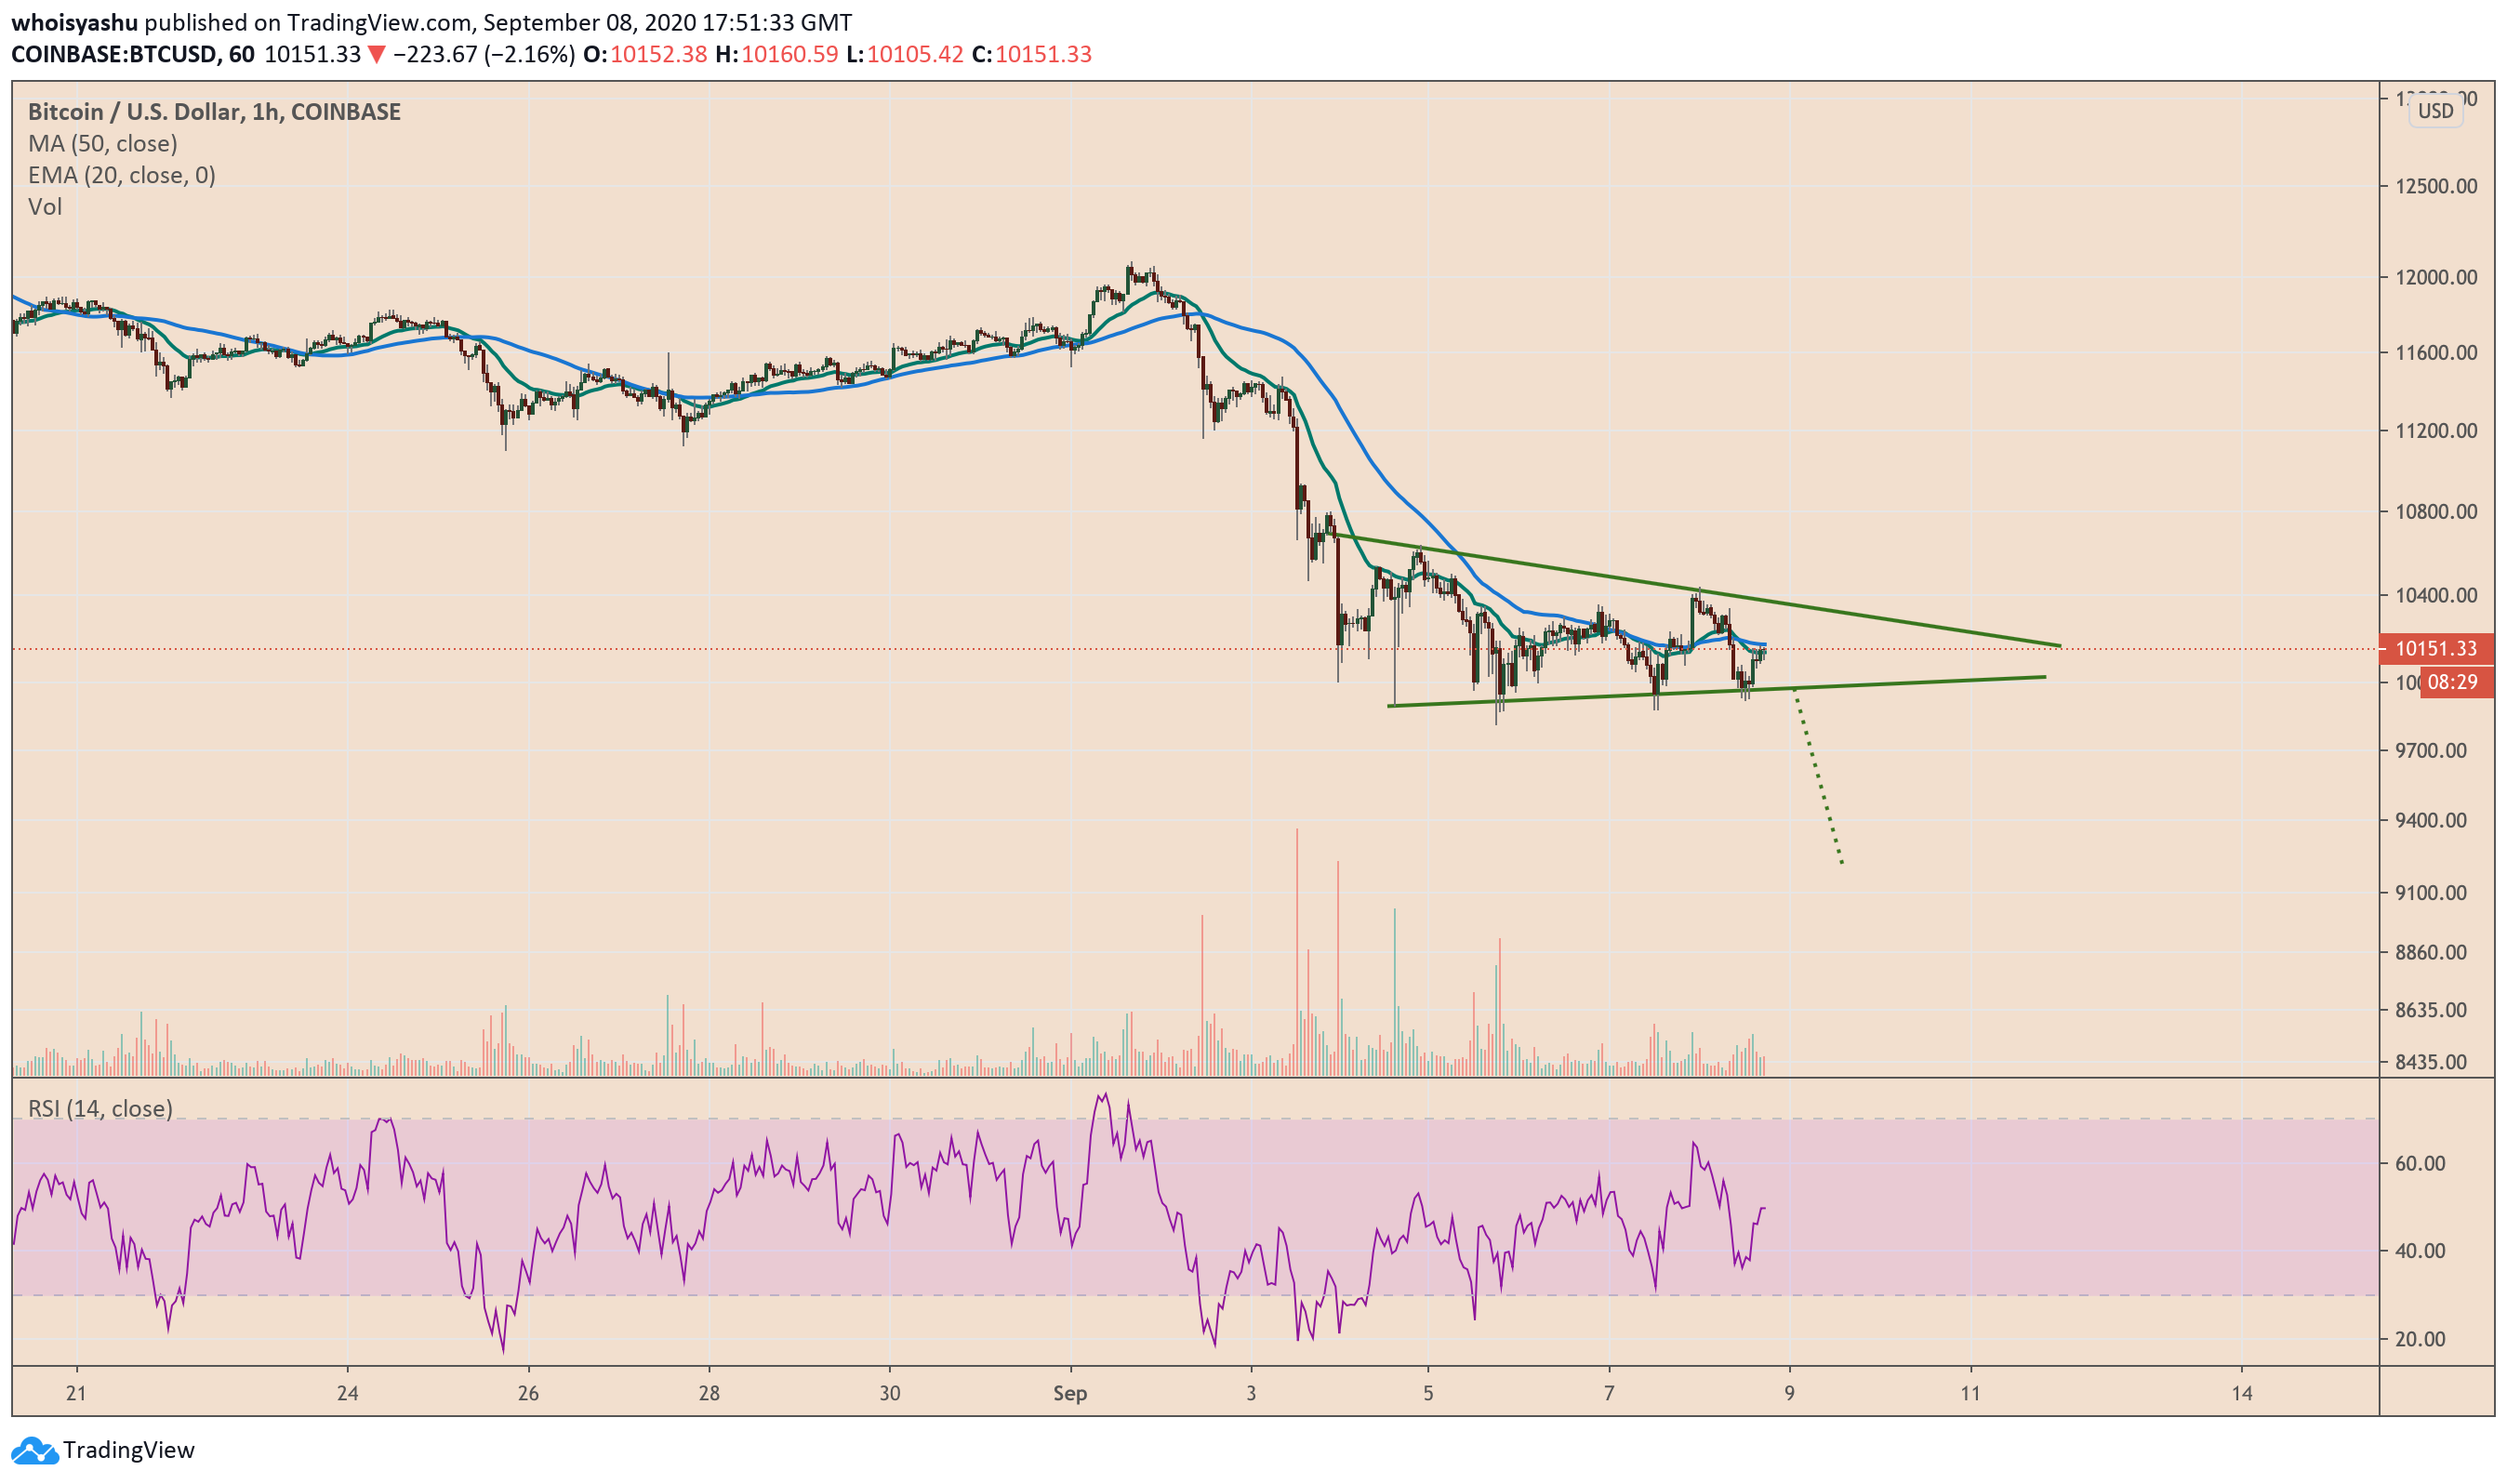
Part of the reason for an extended downtrend comes via a technical pattern known as the Symmetrical Triangle. BTC/USD is currently trading inside an area that confirms a Triangle, confirmed by two converging trendlines connecting a string of sequential peaks and troughs.
The Triangle is a part of a bearish correction, which technically indicates a continuation to the downside. At best, a break below the pattern’s lower trendline risks sending the BTC/USD rate lower by as much as the height of the Triangle. That puts the pair’s downside target roughly near $9,200.
Bitcoin Weekly Outlook
A weekly outlook for BTC/USD is telling a better story. The pair is currently trading above a long-term crucial support defined by its 20-week exponential moving average (the green wave in the chart below).
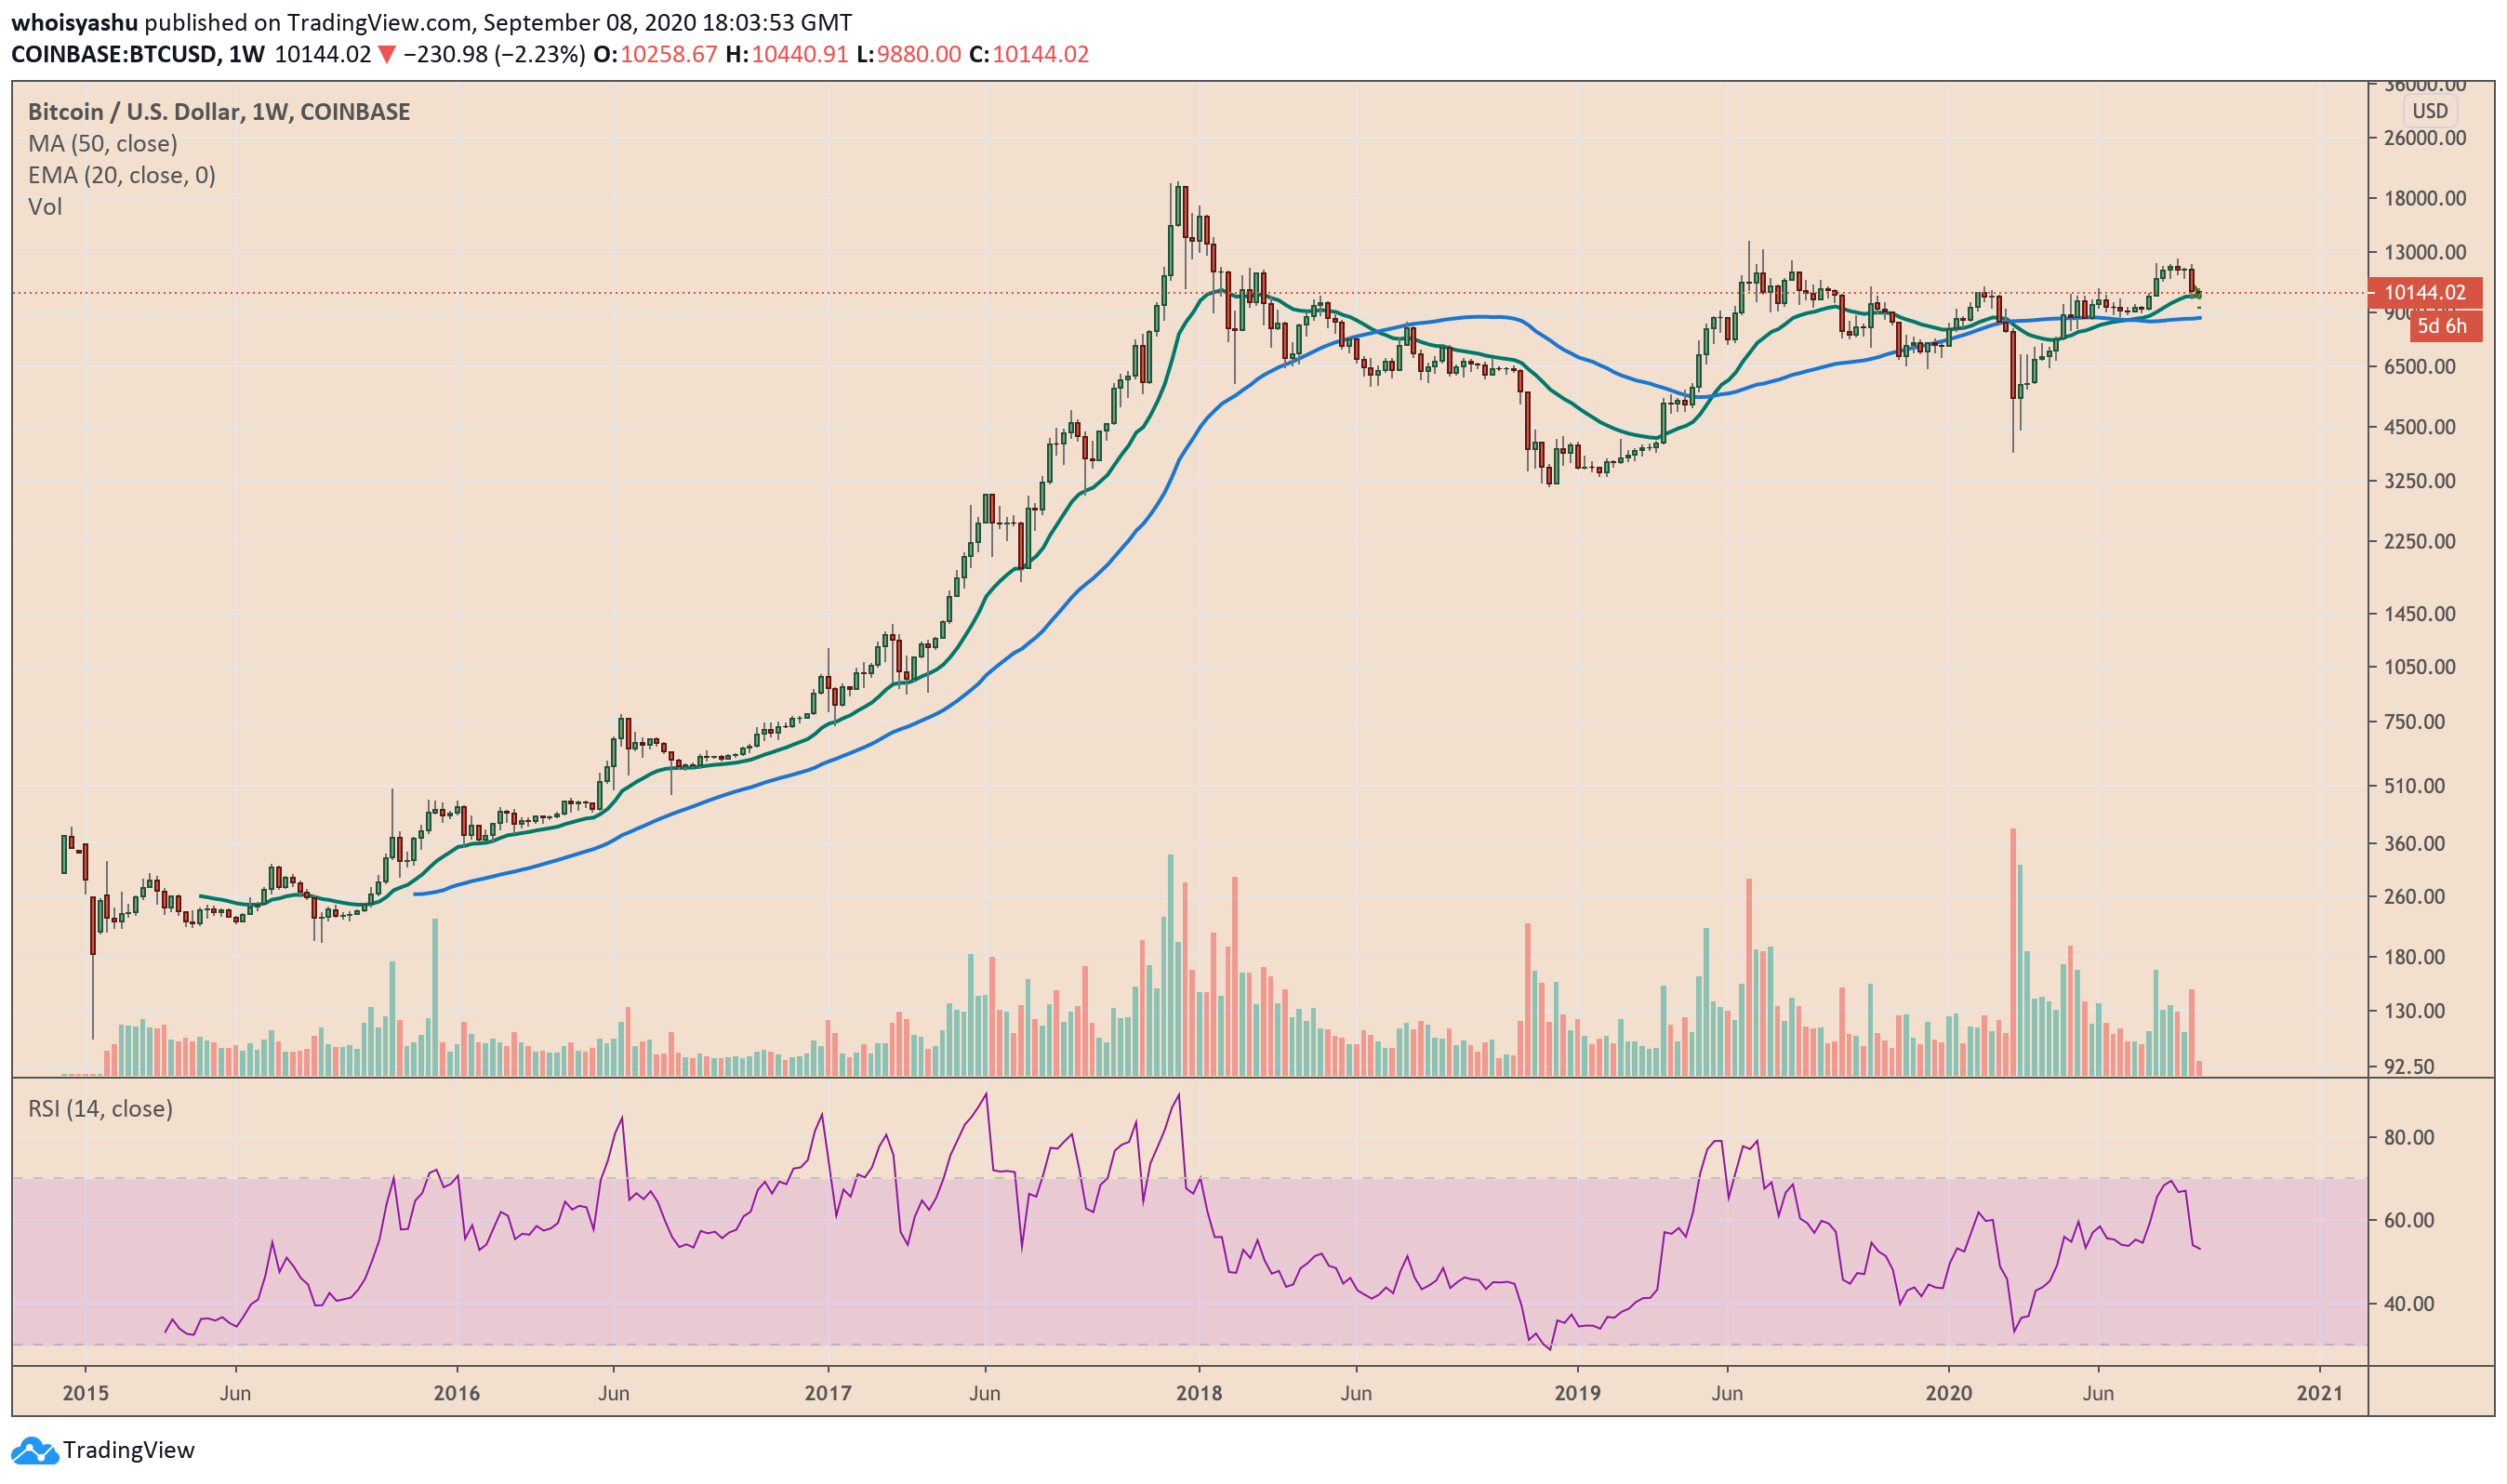
There have been two consecutive attempts to break below the 20-WMA, both leading to a minor pullback to the upside. Nevertheless, the Bitcoin market is lacking adequate buying pressure at the local tops near $10,300, which further increases its risk of losing the 20-WMA as support.
Should that happen, the next weekly downside target for BTC/USD is at the 50-week simple moving average, as per old fractals. The blue wave is currently sitting at $8,750, much lower than the hourly downside target of $9,200.
However, if bulls manage to find a strong foothold above 20-WMA, followed by a voluminous upside move above $10,300, BTC/USD could reclaim $10,500. That would increase the pair’s likelihood of resuming its uptrend towards $12,500.