
The US Dollar Index on Friday extended the current declines towards weekly lows following the latest round of consumer price index data. The USDX dropped off a slightly ascending wedge in mid-week and has since continued to fall amind increased bearish pressure.
The DXY is now trading below the 100-hour and the 200-hour SMA lines in the 60-min chart. This pullback has pushed the dollar currency index towards oversold levels of the 14-hour RSI. This could trigger a temporary rebound.
The US Dollar Index Fundamentals Overview

From a fundamental perspective, the USDX is trading at the back of a relatively busy period in the US market. On Thursday, the US consumer price index for October missed the (MoM) expectation of 0.2% with a change of 0.0%. The (YoY) equivalent also came short of 1.3% with 1.2%. The US CPI ex-food and energy missed the (MoM) expectation of 0.2% with 0.0% while the (YoY) equivalent also failed to match 1.8% with a change of 1.6%. The initial jobless claims for the week ending Nov. 6 beat the expectation of 734k with 709k. The continuing claims for the preceding week also outperformed 6.9 million claims with 6.786M.
On Friday, the preliminary Michigan Consumer Sentiment Index for November missed the expectation of 82 with 77. The US producer price index ex-food and energy for October also came short of the (MoM) and (YoY) expectations of 0.2% and 1.2%, respectively with 0.1% and 1.1%. On the other hand, general PPI for the period outperformed 0.2% (MoM) and 0.4% (YoY) with 0.3% and 0.5%, respectively.
The US Dollar Index Technical Analysis (the 60-min Chart)
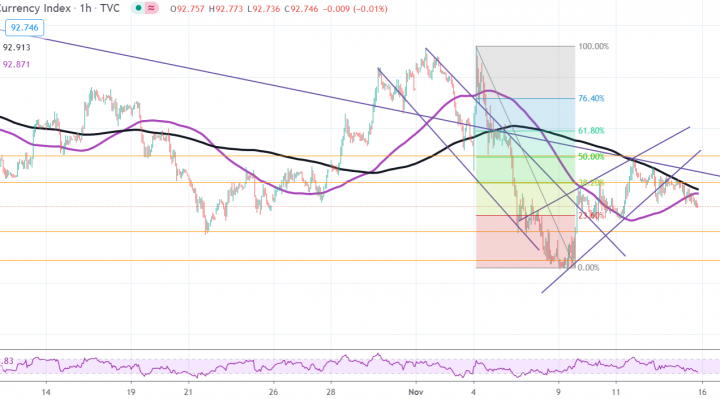
Technically, the US dollar index appears to have recently broken out of an ascending wedge in the 60-min chart. This indicates an attempt by the bears to take control of the DXY in the short-term.
They will be targeting short-term profits at around 92.50 or lower at 92.22. On the other hand, the bulls will look to pounce for profits at around 38.20% and 50% fib levels at 92.98 and 93.23, respectively.
The US Dollar Index Technical Analysis (the Daily Chart)
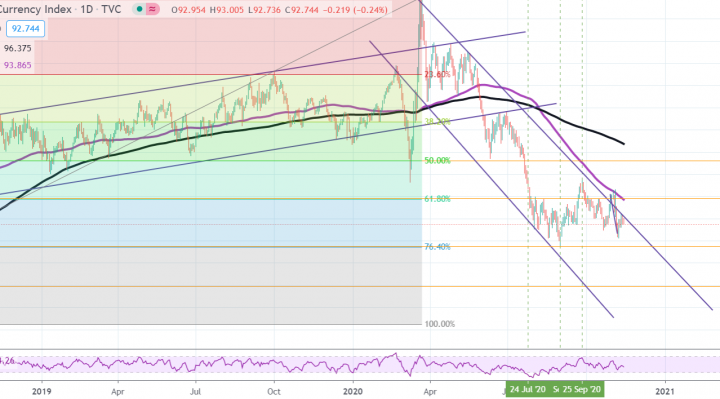
In the daily chart, the USDX appears to be trading within a descending channel. It has dropped to trade between 61.80% and 76.40% fib levels. It remains pinned just below the 100-day SMA while the 200-day SMA is several levels higher.
The bulls will be targeting long-term profits at around 61.80% and 50% fib levels at 93.91 and 95.61, respectively. On the other hand, the bears will look to pounce for profits at around 76.40% fib level at 91.73 or lower at 89.95.