
PG Long-term outlook

The pressure in PG stock price brought it down and close at $82.46, down $4.12 from November opening price. The sell-off continue on the first day of December as the share price print new low at $81.18. Although it is unfavorable for PG, the stock price reverses its losses and never turn lower below the $81.18 low.

Despite the rally in share prices, the company receives downgrade from Deutsche Bank from “Buy” to “Hold.” Deutsche Bank cited the stock is fairly valued but does not see near term catalyst over next few quarters. This might mean the stock price continue in its course either sideway or bullish.
New Month
Monthly chart
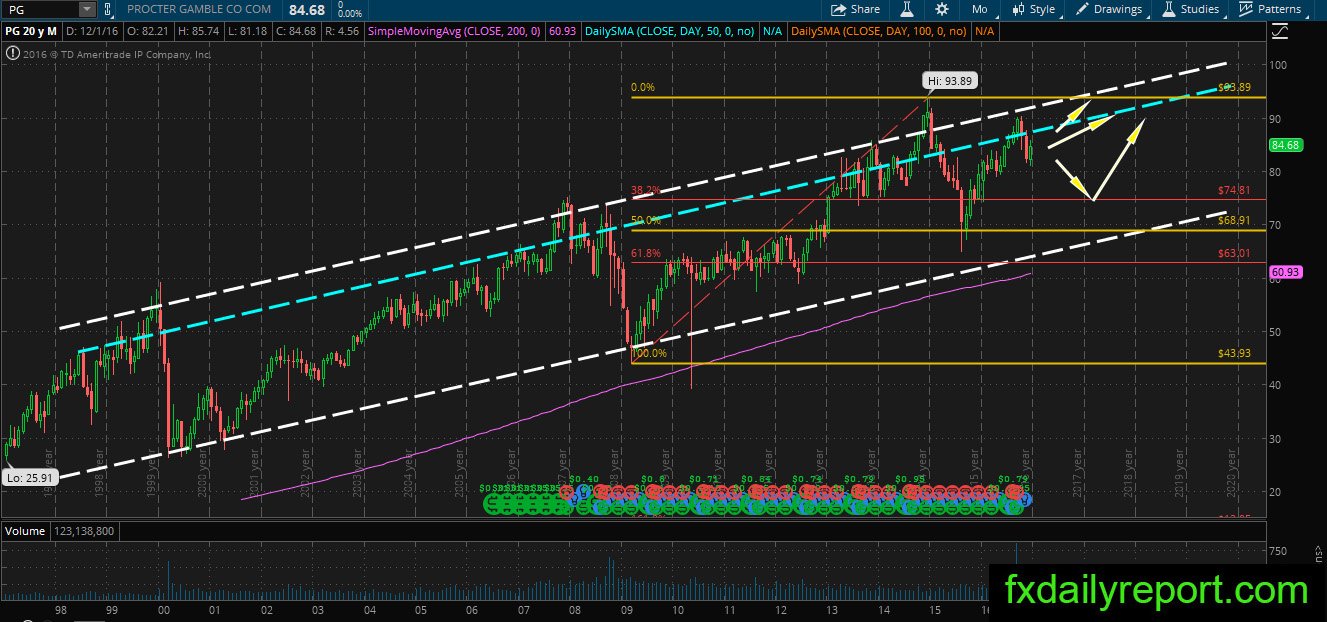
Rejection happened in PG, and the price slide lowers below the blue trend line which is the target of bullish movement. The share price could either attempt another rally toward the blue trendline and also upper white channel as an extension. Otherwise, it will move lower toward the Fibonacci retracement 50% level or the lower part of the white channel.
Weekly chart
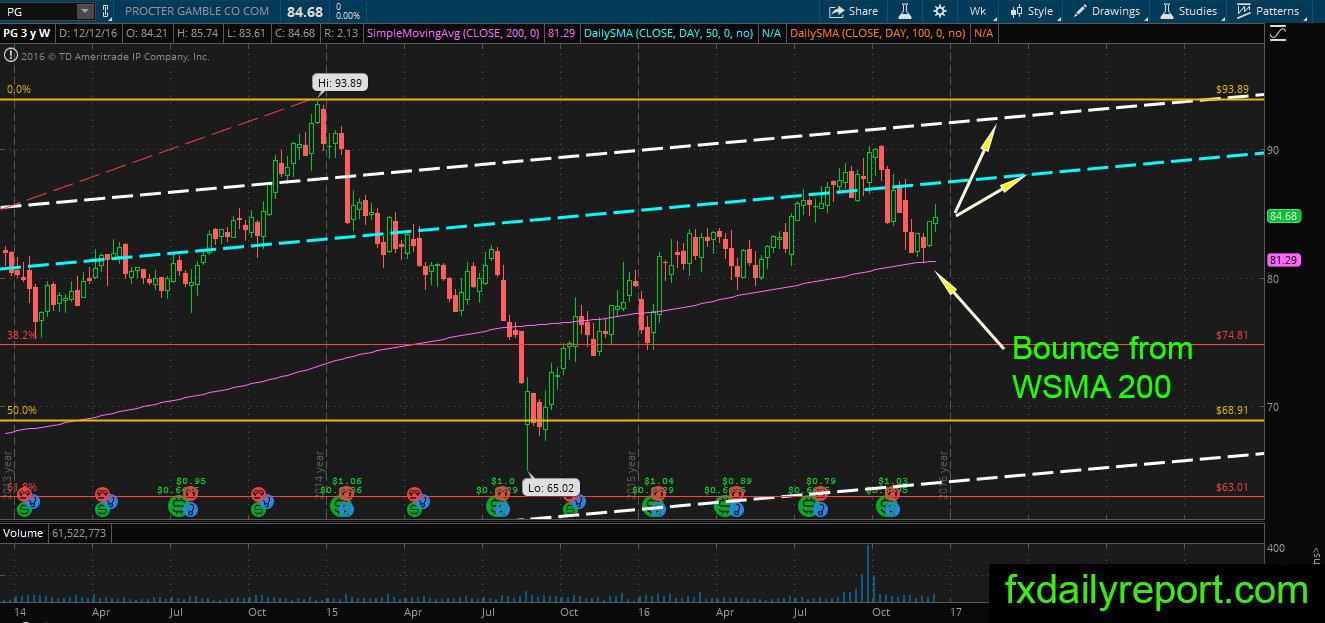
The bullish trend continues after PG successful bounce from its WSMA 200 in the weekly chart. Similar to the monthly chart, it has target at the blue trendline or the upper white channel. If the price manage to close lower than WSMA 200, then it will cancel bullish view and change overall medium-term trend into bearish.
Daily chart
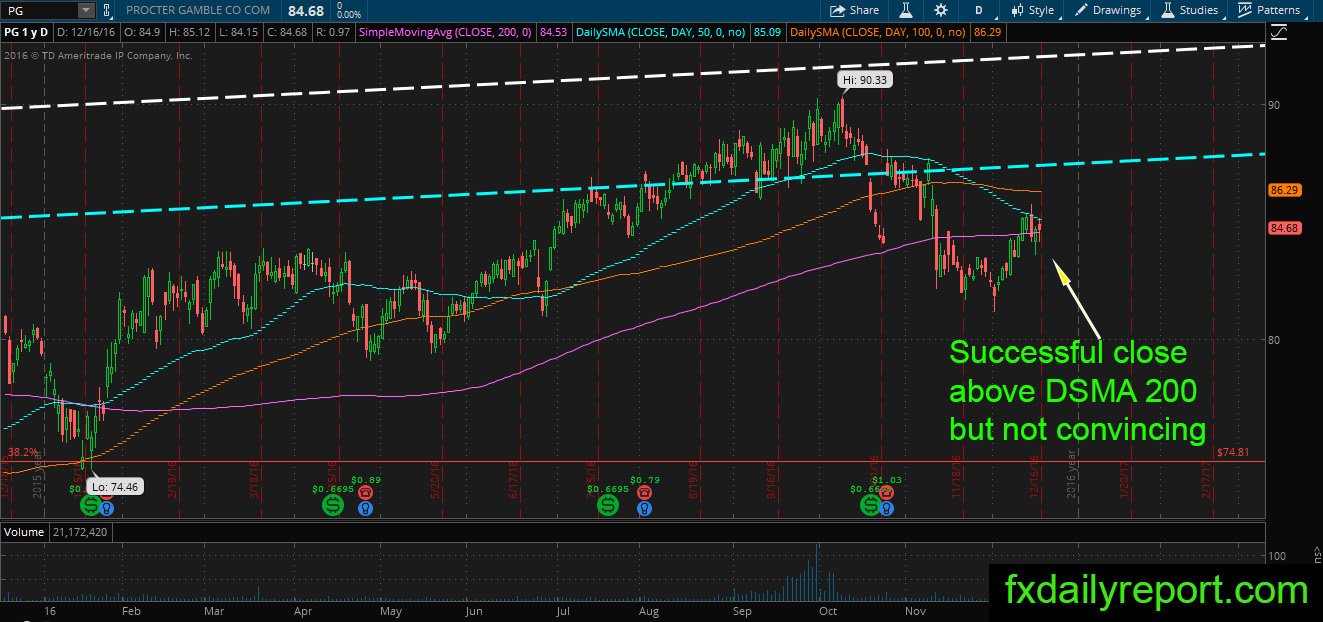
Despite the strength shown in the weekly and monthly chart. PG is relatively bearish in the daily chart as the price test the broken daily SMA 200. It successfully closes above averages but not yet escape the bearish pressure, if bearish candlestick pattern formed at the averages and the price closed lower, then PG will enter short-term bearish trend.
Trade plan
Bullish traders need to wait until price retraced lower, or they can take a trade from the daily SMA 200 with the assumption it will move toward the blue trendline.
A short position could be taken when the price failed daily SMA 200 test. Alternatively, traders can observe how price react if it is able to reach the upper white channel or the blue trendline.