
The US dollar currency index on Friday bounced off the current weekly lows of about 91.51 to top 91.81 after the US data. The USDX pulled back late on to continue trading within the descending channel formation.
The dollar index is now pinned to the 100-hour moving average in the 60-min chart. Friday’s late pullback prevented the DXY from rallying to overbought conditions in the 14-hour RSI.
The US Dollar Index Fundamentals Overview

From a fundamental perspective, the USDX is trading at the back of a relatively busy period in the US market. On Friday, the US core personal consumption expenditures price index for May missed the expectation of 0.6% with 0.5% (MoM). The (YoY) equivalent matched the expected change of 3.4%. On the other hand, the Michigan Consumer Sentiment Index for June missed the expectation of 86.5 with 85.5. Personal spending for May came short of the expectation of 0.4% with a change of 0.0% while personal income came in better than expected at -2% versus -2.5%.
Earlier in the week, the initial jobless claims for the week ending June 18 missed the expected claim count of 380k with a tally of 411k. Adjusted durable goods orders for May also came short of 2.7% with a change of 2.3% while nondefense capital goods orders ex-aircraft missed 0.6% with -0.1%. The annualized US GDP (revised) for Q1 was in line with expectations at 6.4%.
The US Dollar Index Technical Analysis (the 60-min Chart)
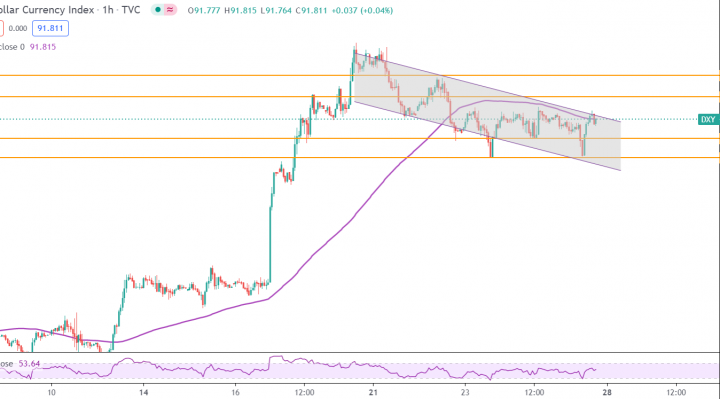
Technically, the USDX appears to b trading within a descending channel formation in the 60-min chart. This indicates a significant short-term bearish bias in the market sentiment. It pulled back late on Friday to avoid crossing to overbought conditions after a sharp rebound.
The bulls will be looking to extend the current rebound towards 91.98 or higher to 92.15. On the other hand, the bears will look to pounce on short-term pullbacks at around 91.66 or lower a 91.51
The US Dollar Index Technical Analysis (the Daily Chart)
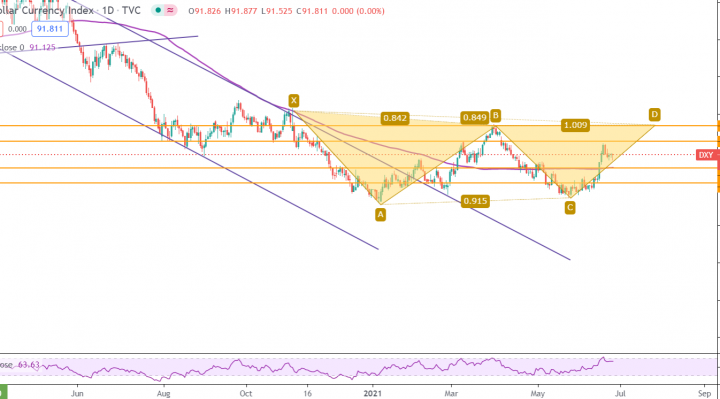
In the daily chart, the USDX appears to be on course to complete a double-bottom reversal pattern formation, XABCD. It continues to trade very close to the overbought levels of the 14-day RSI. This could trigger a temporary pullback.
The bulls will be looking to complete the reversal by targeting profits at around 92.54 or higher at 93.37. On the other hand, the bears will look to pounce for profits at around 91.01 or lower at 90.28.