
AAPL Long-term outlook
AAPL market cap continues to grow exponentially, and the market cap jumped from $700+ billion to $800 billion in just one month.Strong sales of iPhone 7 and iPhone 7+ is one of the reasons why the market is hot on AAPL shares. Aside from iPhone sales, there is news iPhone 8 production started one month earlier than scheduled. AAPL expected to announce iPhone 8 in September and sell it abroad in October.

Click here to read April 2017 analysis
New Month
Monthly chart

Overly bullish AAPL broke through the top of the channel and printed new record high. There is nothing to stop the share price upward movement and traders might want to stay sideline as the share price venture into the uncharted area. If the price corrected from the current level, it would head to the previously broken extreme high around $133.
Weekly chart
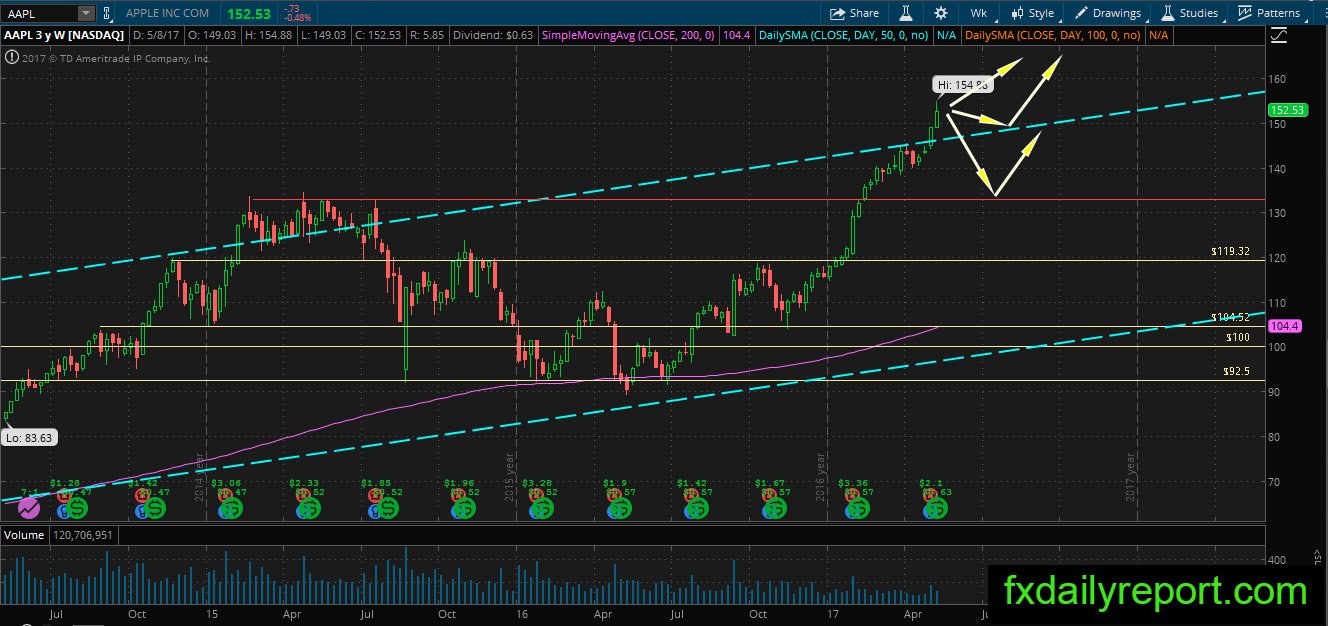
AAPL weekly chart looks more bullish than the monthly chart as price aggressively moves above the top of the channel. Similar to the monthly chart, the nearest resistance is the round number $160 which could be reached if current momentum is intact.
Daily chart

There is possible bearish evening star pattern on daily chart of AAPL. Although the formation of pattern is not ideal, the location might play a major part if the pattern triggered. The price needs to move below $152.11 initially and below $149 to confirm the pattern.
Trade plan
The long position might need to wait until the price corrected and find support around $133 and $150
The short position could be taken after the break of evening star pattern on daily chart.