
BBBY Long-term outlook

Bed Bath & Beyond share prices on the path lower without any resistance. If we use analog in baseball, we could compare it to a home run. Down from $23.41 to $19.90 in October, BBBY lost 14.99% of its value. Since the beginning of this year, BBBY has lost 51.3% of its value base on October close.

From the fundamental side, there is one question to ask. Is the price of BBBY at current level cheap? We will look at some data.
1. Total revenue up from 12,103.9 million to 12,215.8 million but net income fall from 841.5 million to 685.1 million. This is a mixed result, the company sales up but the use of discount coupon cost the company from profitability side.
2. Debt to equity ratio is 0.55 which is normal compared to industry average 0.51
3. P/E ratio at 5.43 vs. industry of 47.39
Base on the data from MSN money, we could say BBBY share prices are really cheap, but the future of the company might come under question as it losses market shares continuously.
Click here to read BBBY October analysis
New Month
Monthly chart

BBBY losses mount on the monthly chart, and the bear was in winning streak since December last year. There is no sign of bull except this month. The bull attempt to made the first bullish candle, and it is still in progress. There is no conclusion yet, and it is better to stay sideline for now as the share prices might reverse by the end of the month and closed bearish.
Weekly chart
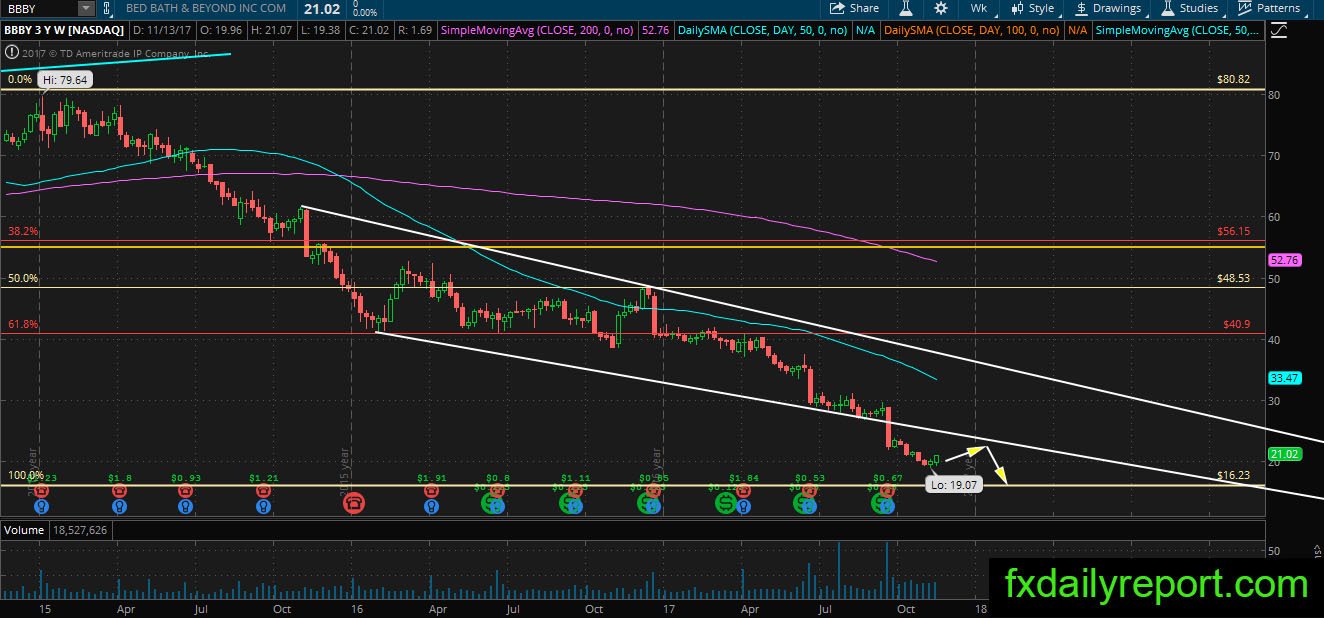
Nothing interesting on the weekly chart as price consistently move lower. The trend is down which is better for traders to look for a short position. If the share prices move up, traders could look for short position near the trend line.
Daily chart

The setup on daily chart unchanged, each time share prices move up it is being sold near the daily SMA 50. Traders could look for short position near the averages.
Trade plan (No change compared to October)
Long position might need to wait until the share prices hit 2009 low at $16.23
A short position could be taken near the daily SMA 50