
The price of bitcoin on Tuesday continued to trade within a consolidative triangle formation after finding support off 100-hour SMA. The 200-hour SMA remains a few levels below the BTC/USD.
The price of the pioneer cryptocurrency also appears centrally positioned in the 14-hour RSI in the 60-min chart. This suggests that the current consolidative pattern formation could continue in the coming days. However, bitcoin looks closer to another breakout.
Bitcoin Price Fundamentals Overview

From a fundamental perspective, bitcoin is trading at the back of a relatively busy period in the market. The price of the pioneer cryptocurrency continues to gain traction in the mainstream financial industry with more multinational companies embracing it. Several banking institutions have already embraced crypto in various ways including launching their own cryptocurrencies and issuing bitcoin-tradable bonds. Leading online payments platform now accept crypto payments while online stores were among the first to adapt to the changes.
Bitcoin also continues to gain leeway among young investors seeking an alternative to safe-haven investments like gold. This has created the demand for bitcoin at a time when global financial markets are facing a potential crisis. The covid-19 pandemic is still with us despite the roll-out of several vaccines. The new covid strain is causing concern and this has boosted the demand for bitcoin.
Bitcoin Price Technical Analysis (the 60-min Chart)
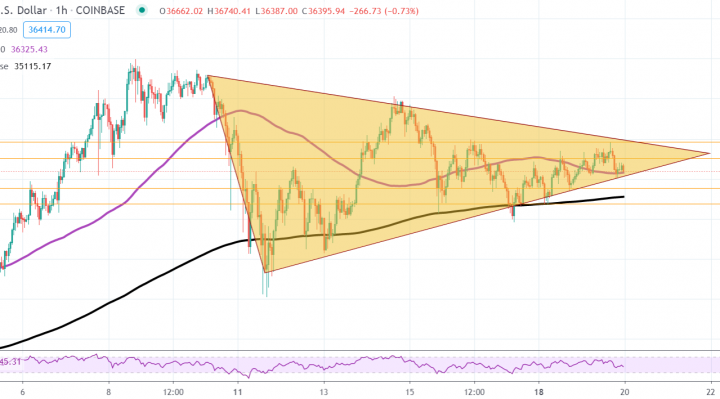
Technically, the price of bitcoin appears to be trading within a consolidative triangle formation in the 60-min chart. Bitcoin also appears to have found support off the 100-hour SMA. This could push the price up again towards the top trendline of the triangle.
The bulls will be targeting short-term rebound profits at around $37,029 or higher at $37,859. On the other hand, the bears will look to pounce for short-term profits at around $35,551 or lower at $34,740.
Bitcoin Price Technical Analysis (the Daily Chart)
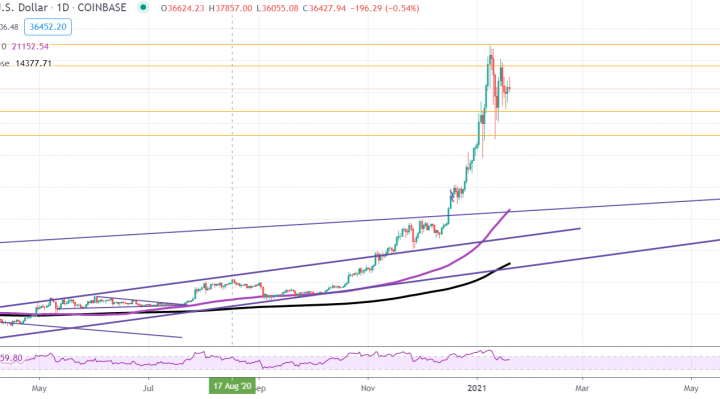
In the daily chart, the BTC/USD appears to be trading within a consolidative pattern formation after pulling back off all-time highs. Bitcoin is now pinned several levels above the current levels of the 100-day and the 200-day SMA lines. It remains very close to overbought levels of the 14-day RSI despite the recent pullback.
The bulls will target long-term profits at around $39,335 or higher at $42,021. On the other hand, the bears will look to extend the current pullbacks towards $33,345 or lower to $30,560.