
Bitcoin plunged sharply into the Monday session as traders decided to lock their profits before the US presidential election on November 3.
The decline in the world’s largest cryptocurrency followed its rally to $14,000, a level it last touched in 2018 amid a correction from its all-time high near $20,000. In 2019, the price came closer to hitting $14,000 but fell short at $13,868 (data from Coinbase).

The level had a historical significance as a sell-off area that partially explains why traders increased their short exposure near it. Meanwhile, Bitcoin’s Relative Strength Index on a daily chart had flown into the ‘overbought’ territory that also amounted to a neutralizing price correction.
As a result, Bitcoin declined by up to 4.04 percent to trade an intraday low of $13,215. Nevertheless, the cryptocurrency showed signs of a significant rebound near the level as the price quickly bounced back after testing it as support.
Bullish Indicator Appears
If one looks closely, the Bitcoin 4H chart shows a confluence of two technical supports near $13,215. First, the level was acting as the resistance in the sessions between October 21 and October 27. But it flipped into a price floor upon a breakout move towards $14,000.
Second, the level coincides with the lower trendline of an Ascending Triangle that now stands partially confirmed.
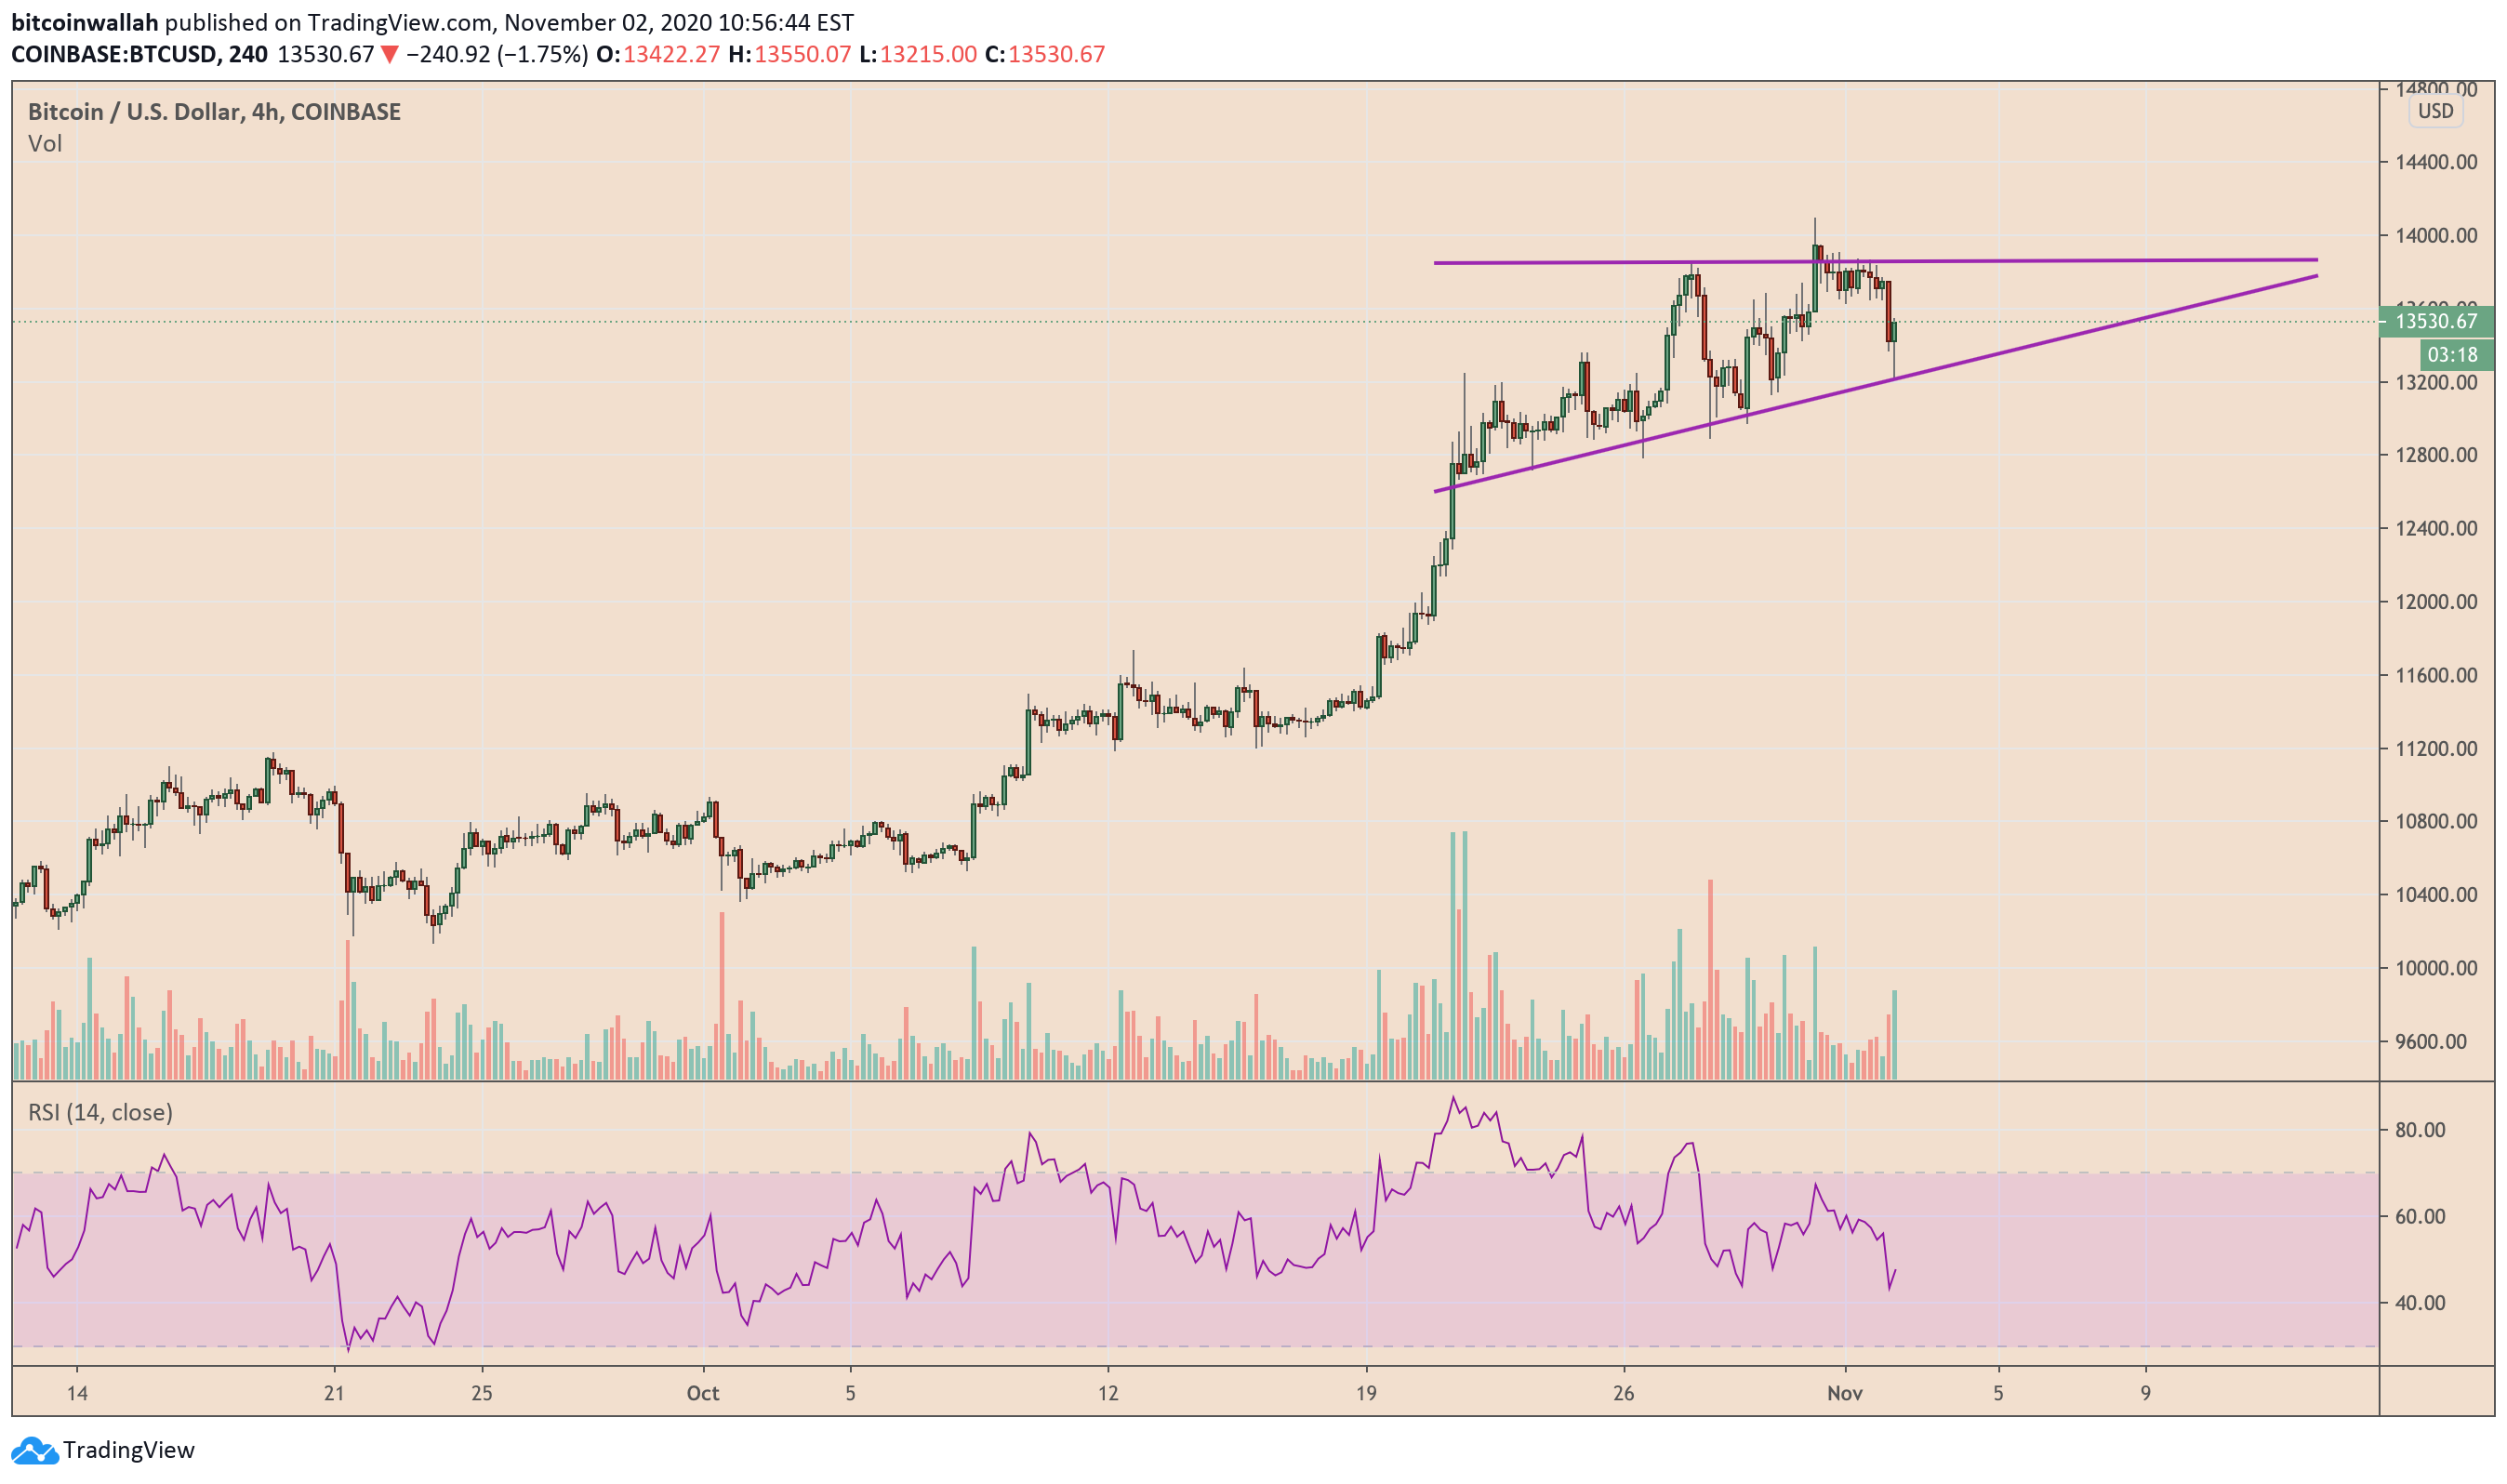
An Ascending Triangle pattern indicates a bullish continuation sentiment in the market. It consists of an upward slope that provides support against an asset’s bearish attempts – and a resistance line that limits its upside attempts only to allow it later to pass as a breakout move towards a specific bullish target.
Bitcoin is trading inside such a bullish pattern. Its latest retest of the upward slope confirms a strong buying sentiment near the trendline. That should allow the cryptocurrency to rebound back towards the resistance line (at near $10,850). Meanwhile, in the event of a breakout, the price should technically rise by as much as the maximum height of the Triangle (it is more than $1,000).
That puts Bitcoin en route to the price target of $10,850 + $1,000 = $11,850.
More Bitcoin Bulls
The fundamentals support a bullish outcome. Traders agree that the Bitcoin price could rise after a clear electoral outcome in the US. The winning candidate – Donald Trump or Joe Biden – and his party would assume control of the US Senate and Congress. That would make it easier for them to pass the second coronavirus stimulus package.
Bitcoin had risen by more than 200 percent after the first fiscal aid in April 2020.