
The Bitcoin price on Friday bounced off the key support at about $66,970 to trade at about $68,240 after the latest round of data. The BTC/USD appears to be trading within a descending channel formation in the 60-minute chart.
Despite the rebound, Bitcoin continues to trade below the 100-hour moving average line. The price of the pioneer cryptocurrency has now recovered to move closer to overbought levels of the 14-hour RSI.
Bitcoin Price Fundamentals Overview

From a fundamental perspective, the BTC/USD is trading at the back of a relatively busy period in the market. On Thursday, the US Securities and Exchange Commission approved the Ethereum Spot ETFs, opening another crypto asset to traditional investors.
The announcement came shortly after the US House of Representatives passed the Financial Innovation and Technology for the 21st Century (FIT21) Act, which provides clear circumstances under which a crypto asset is to be treated as a security. The bill has two more hurdles to pass before becoming law, including passing the Senate vote and Approval by the White House.
In the latest round of US data, the durable goods orders for April outperformed the expected change of -0.8% with a change of 0.7%, while the durable goods orders ex-transportation outshone the forecast of 0.1% with a change of 0.4%.
On the other hand, the nondefense capital goods orders ex-aircraft exceeded the estimate of 0.1% with a change of 0.3%. Elsewhere, the Michigan Consumer Sentiment Index for May beat the expectation of 67.5 with a reading of 69.1, while the UoM 5-year inflation expectations for the month missed 3.1% with a rate of 3%.
Bitcoin Price Technical Analysis – the 60-min Chart
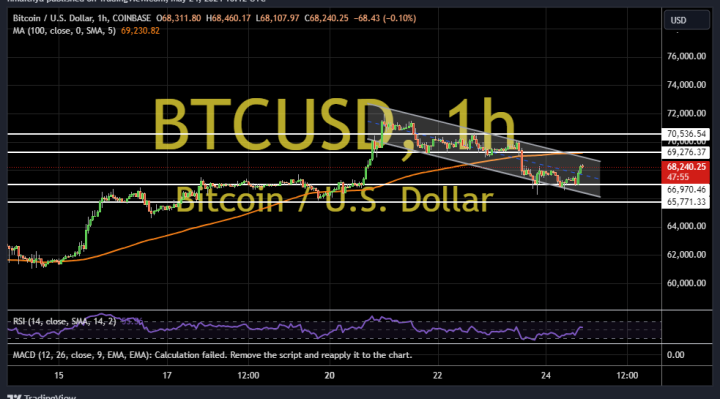
Technically, the price of pioneer cryptocurrency is trading within a descending channel formation in the 60-minute chart. However, the 14-hour has recently bounced back to move closer to overbought conditions.
Therefore, the bulls will be targeting extended gains at about $69,276 or higher at $70,536. On the other hand, the bears will be targeting pullback profits at about $66,970 or lower at $65,771.
Bitcoin Price Technical Analysis – the Daily Chart
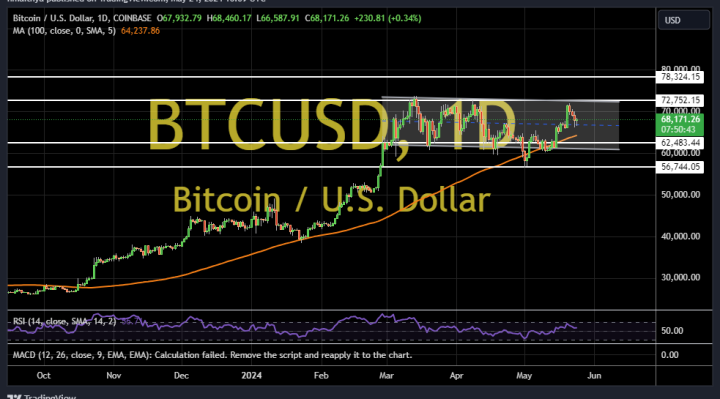
In the daily chart, the BTC/USD appears to be trading within a sideways channel formation. The 14-day RSI also seems to support an indecisive market sentiment after pulling back to avoid entering overbought conditions.
Therefore, the bears will be targeting pullback profits at about $62,483 or lower at $56,744. On the other hand, the bulls will be targeting long-term profits at about $72,752 or higher at $78,324.