
On Wednesday, the GBP/USD currency pair bounced back from the session lows of about 1.3136 to trade at about 1.3198. The currency pair trades within a sideways channel formation on the 60-minute chart.
The pair continues to trade slightly below the 100-hour moving average line, despite the rebound. As a result, the currency pair still has plenty of room left to run before reaching the overbought levels of the 14-hour RSI.
GBP/USD Fundamentals Overview

From a fundamental perspective, the GBP/USD currency pair trades during a relatively busy period in the US market. On Wednesday, the US consumer price index for September increased to 3.7%, up from 3.4% on a year-over-year basis, ahead of the forecast change of 3.6%. The (MoM) equivalent also edged higher to 0.6%, up from 0.4% in August, in line with forecasts.
On the other hand, the consumer price index ex-food and energy for the month remained unchanged at 0.3% (MoM), beating the forecast change of 0.2%. The (YoY) equivalent increased to 2.6%, up from 2.4% in August, beating the forecast rate of 2.5%.
Looking forward, traders will be waiting for the US producer price index data for September and the retail sales data for the month on Thursday.
In the UK, traders will be waiting for the gross domestic product data for August and the manufacturing data for the month on Thursday. Earlier in the week, the UK BRC Like-For-Like retail sales for September outperformed the expected (YoY) change of 0.7%, with a change of 1%.
GBP/USD Technical Analysis (the 60-min Chart)
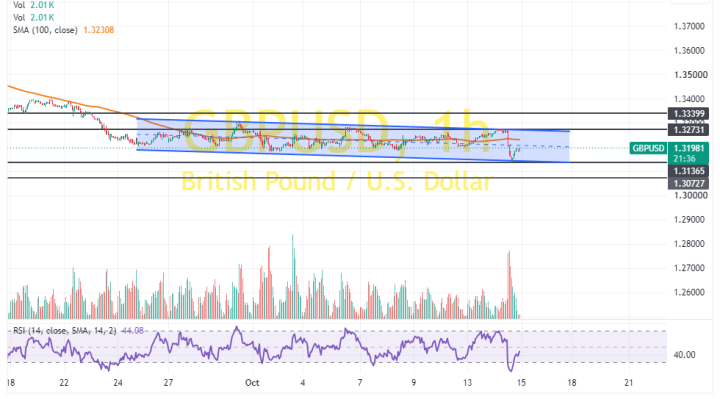
Technically, the GBP/USD currency pair trades within a sideways channel formation on the 60-minute chart. However, the 14-hour RSI has recently bounced back to recover from oversold conditions.
Therefore, the bulls will look to extend the current rebound towards 1.3273 or higher, up to 1.3340. On the other hand, the bears will look to pounce on profits at about 1.3136 or lower, down to 1.3072.
GBP/USD Technical Analysis (the Daily Chart)
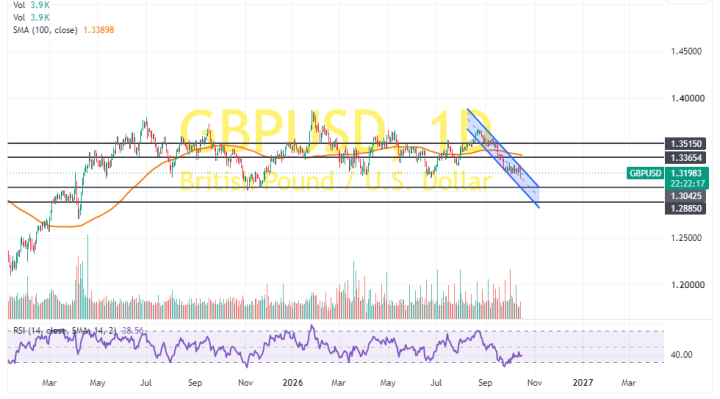
In the daily chart, the GBP/USD currency pair trades within a descending channel formation. However, the 14-day RSI has recently bounced back to avoid falling into oversold conditions.
Therefore, the bulls will look to stretch the current rebound towards 1.3365 or higher, up to 1.3515. On the other hand, the bears will look to pounce on extended declines at about 1.3042 or lower, down to 1.2885.