
On Friday, the Bitcoin price traded sideways around the $82,467 level following Thursday’s sharp pullback. The BTC/USD continues to trade within a descending channel formation in the 60-minute chart.
The price of the pioneer cryptocurrency has since fallen to trade a few levels below the 100-hour moving average line. However, Friday’s late rebound helped it recover from the oversold levels of the 14-hour RSI.
Bitcoin Price Fundamentals Overview

From a fundamental perspective, the BTC/USD trades during a relatively busy period in the U.S. market. On Friday, the Chicago Purchasing Managers’ Index for January outperformed the expectation of 44, with a reading of 54, up from the previous month’s equivalent of 43.5.
The producer price index for December also beat the expected (MoM) change of 0.2%, with a change of 0.5%. The (YoY) equivalent outshone the estimate of 2.7%, with a change of 3%. The producer price index ex-food and energy also exceeded the (MoM) and (YoY) forecasts of 0.2% and 2.9%, respectively, with changes of 0.7% and 3.3%.
Earlier in the week, the Federal Reserve kept the base interest rate unchanged at 3.75%, in line with expectations. Factory orders for November beat the expected change of 1.6%, with a change of 2.7% (MoM). The initial jobless claims for last week fell slightly to 209k, down from 210k in the previous week, missing the forecasted claim count of 205k. Nonfarm productivity and unit labor costs for Q3 matched the estimates of 4.9% and -1.9%, respectively.
Bitcoin Price Technical Analysis (the 60-min Chart)
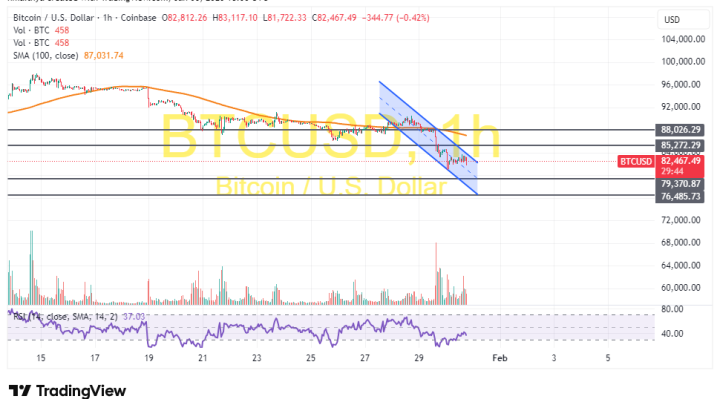
Technically, the Bitcoin price trades within a descending channel formation in the 60-minute chart. However, the 14-hour RSI has recently bounced back to avoid falling into oversold conditions.
Therefore, the bulls will look to stretch the latest rebound towards $85,272 or higher to $88,026. On the other hand, the bears will look to extend the current decline towards $79,370 or lower to $76,485.
Bitcoin Price Technical Analysis (the Daily Chart)
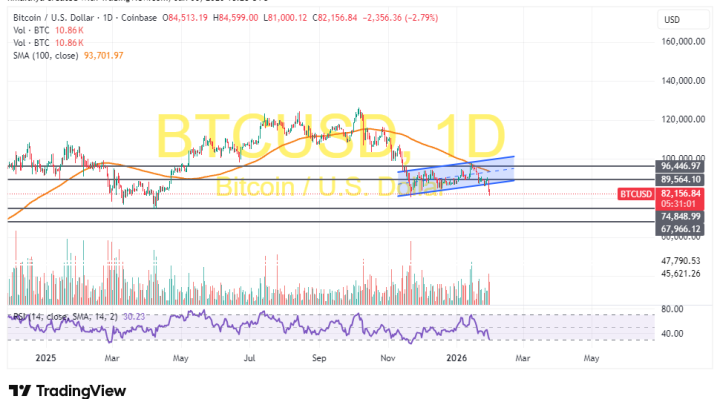
In the daily chart, the price of the pioneer cryptocurrency has completed a downward breakout from an ascending channel formation. The 14-day RSI also supports a long-term bearish bias as it is on the verge of entering oversold conditions.
Therefore, the bears will look to stretch the latest pullback towards $74,848 or lower to $69,966. On the other hand, the bulls will look to pounce on profits at about $89,564 or higher at $96,446.