
The Bitcoin price on Friday pulled back off session highs of about $66,445 to trade at about $63,120 after the latest round of data. The BTC/USD also completed a downward breakout from a descending channel formation.
Bitcoin has now fallen to trade a few levels below the 100-hour moving average line. As a result, the price of the pioneer cryptocurrency appears to be on the verge of entering the oversold conditions of the 14-hour RSI.
Bitcoin Price Fundamentals Overview

From a fundamental perspective, the BTC/USD is trading at the back of a relatively busy period in the US market. On Thursday, the initial jobless claims for the week ending March 15 beat the expected claim count of 215k with a tally of 210k.
The Philadelphia Fed manufacturing Survey for March also outshone the forecast of -2.3 with a reading of 3.2, down from the previous month’s equivalent of 5.2. On the other hand, the preliminary S&P Global Manufacturing Survey for March exceeded expectations of 51.7 with a reading of 52.5, while the Services PMI missed the estimate of 52 with 51.7.
Earlier in the week, the Federal Reserve decided to keep the base interest rate within the range of 5.25%-5.5%, in line with expectations. However, projections for the current year were lowered to 4.6% down from 5.4%.
The first and second-year forecasts are also down to 3.9% and 3.1%, respectively, down from 4.6% and 3.6%, while the long-term projection edged slightly higher to 2.6%, up from 2.5% in the previous update.
Bitcoin Price Technical Analysis (the 60-min Chart)
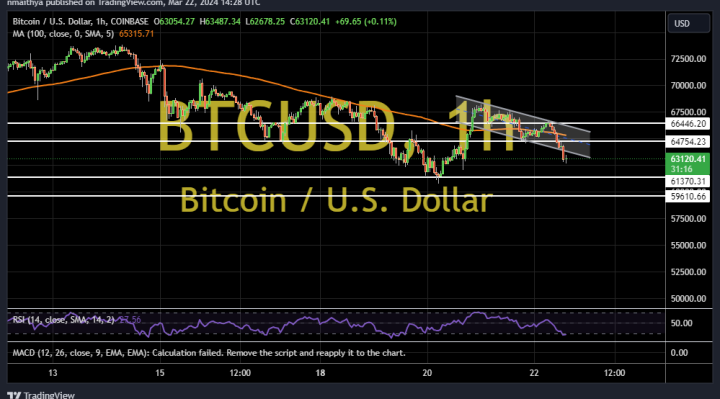
Technically, the Bitcoin price appears to have recently completed a downward breakout from a descending channel formation in the 60-min chart. The 14-hour RSI also seems to support a short-term bearish bias as it edges closer to oversold conditions.
Therefore, the bears will be looking to stretch the current declines toward $61,370 or lower to $59,610. On the other hand, the bulls will look to pounce on rebounds at about $64,754 or higher at $66,446.
Bitcoin Price Technical Analysis (the Daily Chart)
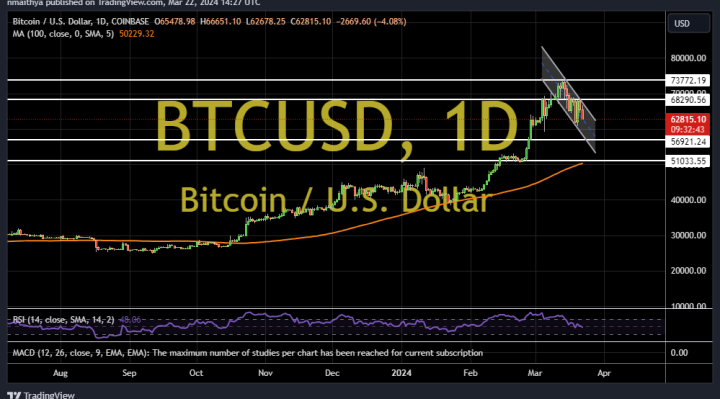
In the daily chart, the BTC/USD appears to be trading within a descending channel formation. The 14-day RSI also seems to have recently pulled back to recover from overbought conditions.
Therefore, the bears will be targeting extended pullbacks at about $56,921 or lower at $51,033. On the other hand, the bulls will look to pounce on profits at about $68,290 or higher at $73,772.