
On Friday, the Bitcoin price pulled back from the session highs of about $65,679 to trade at about $63,957 after the latest data. BTC/USD trades within a descending channel formation on the 60-minute chart.
The price of the pioneer cryptocurrency has now fallen to trade a few levels below the 100-hour moving average line. As a result, it is on the verge of entering the oversold levels of the 14-hour RSI.
Bitcoin Price Fundamentals Overview

From a fundamental perspective, BTC/USD trades during a relatively busy period in the US market. On Friday, the preliminary S&P Global Manufacturing PMI for July missed the expectation of 54.5, with a reading of 53.8, down from 53.9 in June.
On the other hand, the preliminary S&P Global Services PMI for the month rose to 53.6, up from 51.2, beating the forecasted reading of 51. New home sales for June also came in better than expected, at 0.628 million versus a forecast of 0.61 million, up from the previous month’s equivalent of 0.618 million.
On Thursday, the US initial jobless claims for last week came in better than expected, at 187k versus a forecast of 212k, down from the previous week’s equivalent of 209k. The continuing claims for the preceding four weeks also edged slightly lower to 1.796 million, down from 1.798 million.
Elsewhere, the average ADP employment change for the four weeks fell to 16.5k, down from 19.25k. The Kansas Fed Manufacturing Activity for July also edged lower to 17, down from 19 in June.
Bitcoin Price Technical Analysis (the 60-min Chart)
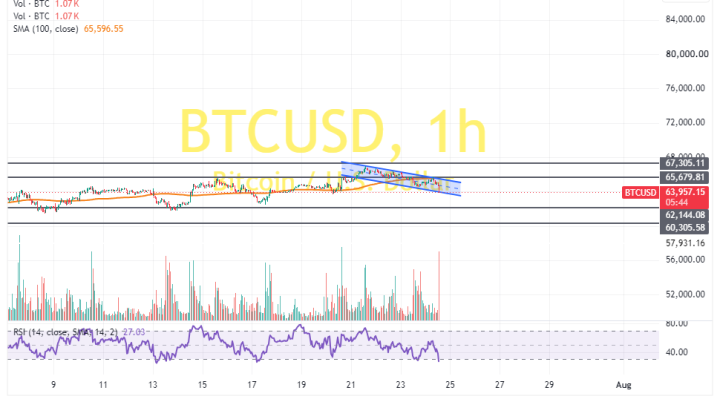
Technically, the Bitcoin price trades within a descending channel formation on the 60-minute chart. The 14-hour RSI also supports a bearish bias after pulling back to move closer to oversold conditions.
Therefore, the bears will look to stretch the current pullback towards $62,144 or lower to $60,305. On the other hand, the bulls will look to pounce on rebounds at about $65,679 or higher at $67,305.
Bitcoin Price Technical Analysis (the Daily Chart)
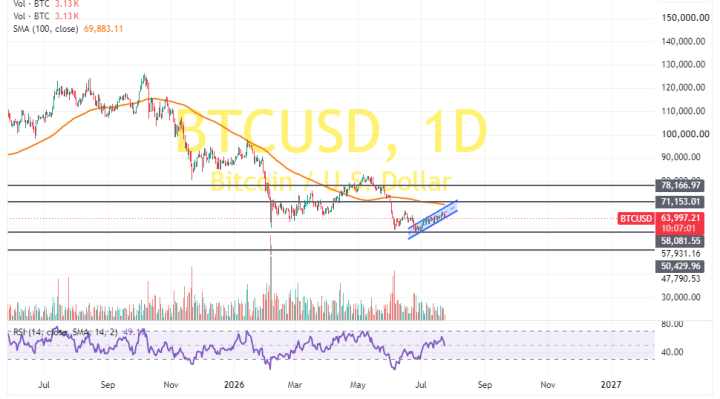
In the daily chart, the price of the pioneer cryptocurrency trades within an ascending channel formation. However, the 14-day RSI has recently pulled back to avoid ascending into overbought conditions.
Therefore, the bears will look to stretch the current pullback towards $58,081 or lower to $50,429. On the other hand, the bulls will look to pounce on profits at about $71,153 or higher at $78,167.