
On Friday, the bitcoin price pulled back from the session highs of about $65,404 to trade at about $64,701 after the latest US data. BTC/USD trades within an ascending channel formation on the 60-minute chart.
The price of the pioneer cryptocurrency continues to trade slightly above the 100-hour moving average line, despite the pullback. As a result, it still has room left to run before reaching the oversold levels of the 14-hour RSI.
Bitcoin Price Fundamentals Overview

From a fundamental perspective, BTC/USD trades during a relatively busy period in the US market. On Friday, nonfarm payrolls for July came in worse than expected, with -23k versus a forecast of 80k, down from the previous month’s equivalent of 20k. The unemployment rate for the month also edged lower to 4.1%, down from 4.2% in June, beating the forecasted rate of 4.2%.
On the other hand, the average hourly wage growth missed the (MoM) forecast of 0.3%, with a change of 0.1%. The (YoY) equivalent also fell short of 3.5%, with a change of 3.2%.
Earlier in the week, the US ADP employment change for July also missed the expected change of 70k, with a change of 44k, down from the previous month’s equivalent of 95k. On the other hand, the S&P Global Composite PMI for the month beat the forecasted reading of 53.6, with a reading of 54.5, up from 53.6 in June.
The ISM Services PMI for the period missed the expectation of 54.5, with a reading of 54.1, up from June’s 54. The US initial jobless claims for last week came in better than expected, with 199k versus a forecast of 202k, up from 198k.
Bitcoin Price Technical Analysis (the 60-min Chart)
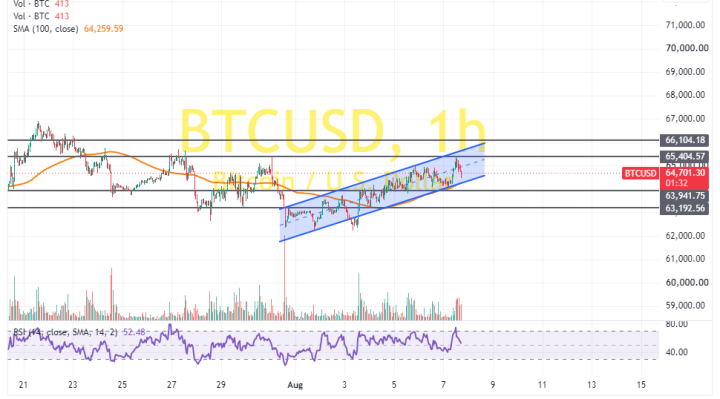
Technically, the bitcoin price trades within an ascending channel formation on the 60-minute chart. However, the 14-hour RSI has recently pulled back to avoid rallying into overbought conditions.
Therefore, the bears will look to stretch the latest pullback towards $63,941 or lower to $63,192. On the other hand, the bulls will look to pounce on profits at about $65,404, or higher at $66,104.
Bitcoin Price Technical Analysis (the Daily Chart)
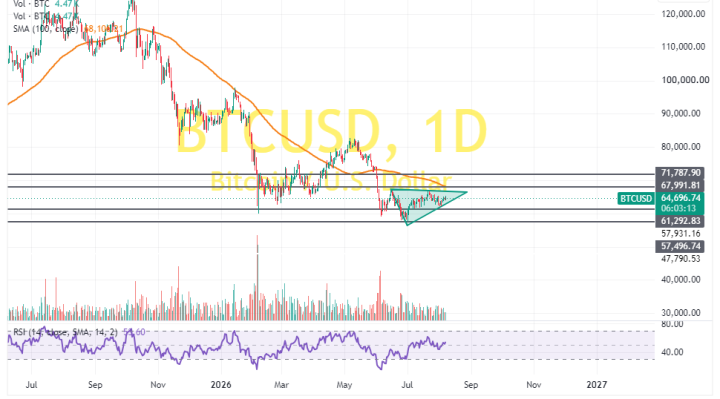
In the daily chart, the price of the pioneer cryptocurrency trades within a consolidative triangle formation. Despite its recent rebound, the 14-day RSI still has room left to run before reaching overbought conditions.
Therefore, the bulls will look to extend the current gains toward $67,991 or higher to $71,787. On the other hand, the bears will look to pounce on profits at about $61,292, or lower at $57,496.