
NZDCAD recently broke down from a long-standing ascending trend line that had guided price higher since early July, confirming a shift in momentum.
The pair tumbled from a high near 0.8276 down to the 0.8083 area before staging a modest bounce, and it’s now testing whether this breakdown has more room to run. The Fibonacci retracement tool, drawn from the 0.8083 low to the 0.8276 high, highlights the levels where sellers could look to reload.

The 38.2% Fib sits at 0.8157, followed by the 50% level at 0.8179, which lines up closely with the broken trend line and could act as a fresh ceiling. A deeper retracement could reach the 61.8% Fib at 0.8202, which would be a critical zone for bears to defend if the downtrend is to resume.
If the retest of the Fib levels fails to attract fresh buying interest, NZDCAD could resume its slide back toward the 0.8083 low or lower. On the other hand, a strong push back above the 61.8% Fib could hint that the breakdown was a false move, opening the door for a return to the prior range.
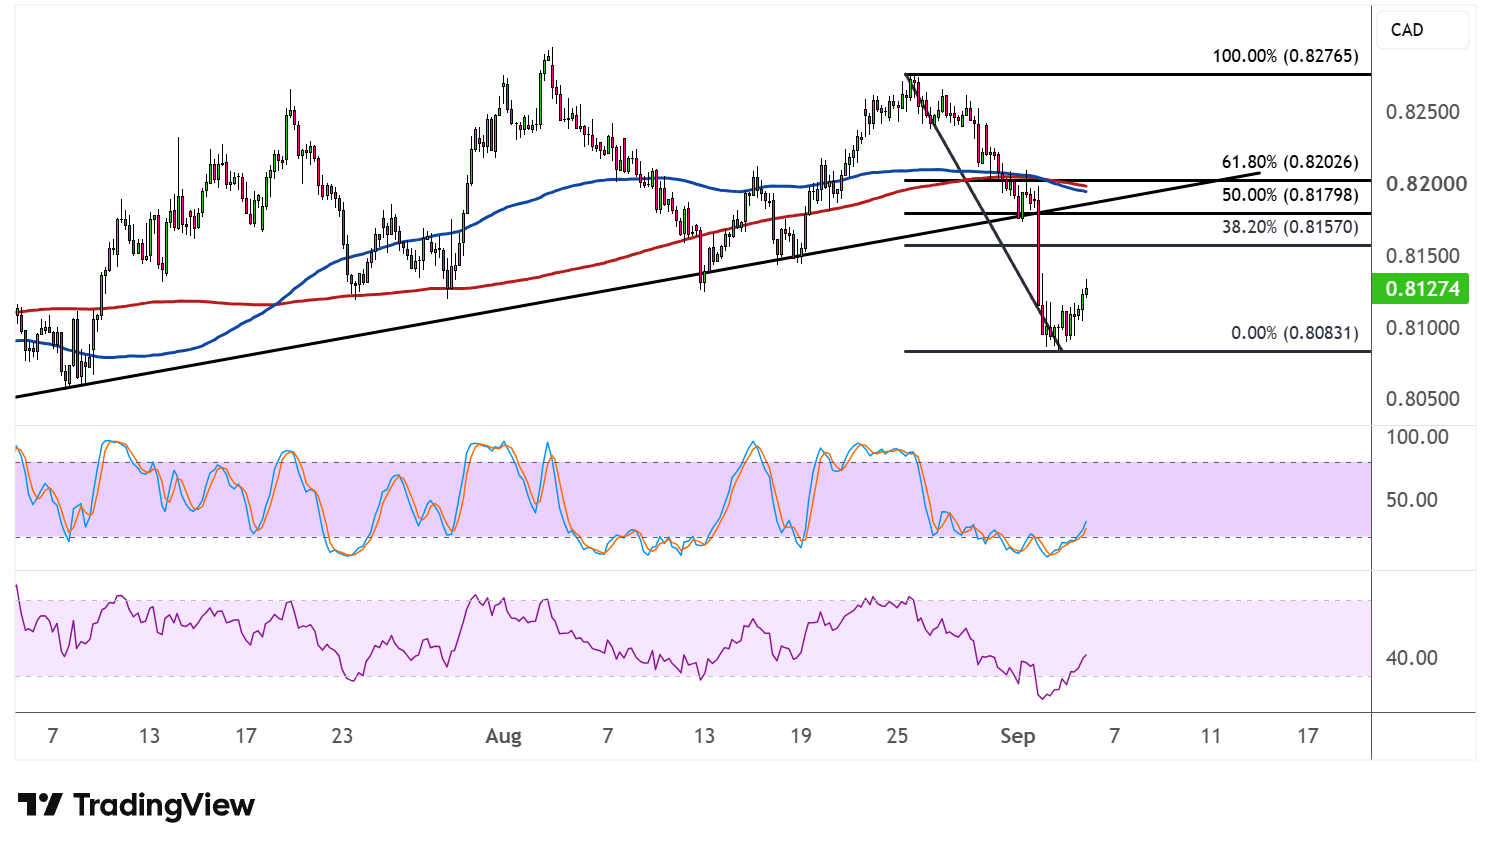
The 100 SMA has already crossed below the 200 SMA, reflecting the shift in momentum, with price now trading beneath both moving averages after spending most of the past two months above them. This crossover reinforces the case that the path of least resistance has turned to the downside, and any rallies into the Fib zone could be viewed as selling opportunities.
Stochastic recently dipped into oversold territory and is now curling higher, suggesting a short-term bounce is underway, though the oscillator still has room to climb before reaching overbought levels. RSI has also ticked up from its recent lows but remains below the midline, indicating that sellers still hold the upper hand for now.
The RBNZ hiked interest rates earlier in the week but dampened expectations of further tightening, dragging the Kiwi lower, while the BOC kept rates on hold while Governor Macklem flagged elevated inflation as a reason for a potential hike soon.