
On Friday, the Bitcoin price extended Thursday’s rebound from lows of about $64,000 to trade above $79,000, before pulling back to $77,800. BTC/USD trades within an ascending channel formation on the 60-minute chart.
The price of the pioneer cryptocurrency has now advanced to trade several levels above the 100-hour moving average line. It continues to trade in overbought conditions of the 14-hour RSI, despite the late pullback.
Bitcoin Price Fundamentals Overview

From a fundamental perspective, BTC/USD trades during a relatively busy period in the US market. On Thursday, the US initial jobless claims for last week came in lower than expected, at 206k versus a forecast of 210k, down from the previous week’s claim count of 212k.
The Philadelphia Fed Manufacturing Survey for August also exceeded the expectation of 25, with a reading of 47.4, up from the preceding month’s equivalent of 41.4.
Earlier in the week, the NY Empire State Manufacturing Index for August also outperformed expectations of 11, with a reading of 20.6, up from the previous month’s 15.6.
Elsewhere, building permits for July outshone the estimate of 1.37 million, with a tally of 1.433 million, up from 1.374 million in June, while housing starts for the month missed the forecast of 1.35 million, with a tally of 1.239 million, down from the preceding month’s equivalent of 1.415 million.
The US industrial production for July also failed to match the forecasted (MoM) change of 0.3%, with a change of 0.2%, while the pending home sales for the month missed 0.3%, with a change of -2.3% (MoM).
Bitcoin Price Technical Analysis (the 60-min Chart)
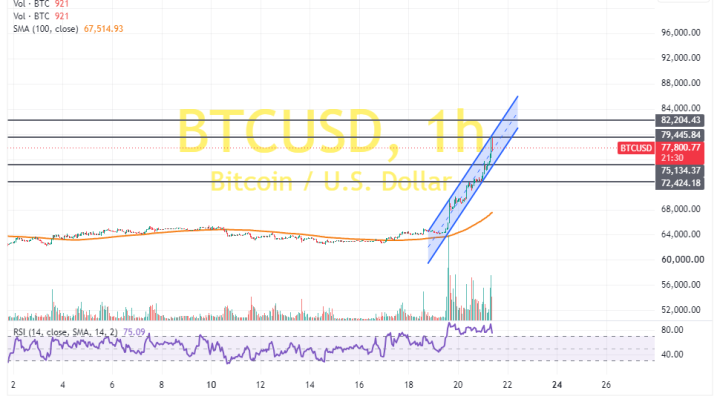
Technically, the Bitcoin price trades within a sharply ascending channel formation on the 60-minute chart. The 14-hour RSI continues to trade in overbought conditions, despite the latest pullback.
Therefore, the bears will look to stretch the current pullback towards $75,134 or lower to $72,424. On the other hand, the bulls will look to ride the current rally towards $79,445 or higher to $82,204.
Bitcoin Price Technical Analysis (the Daily Chart)
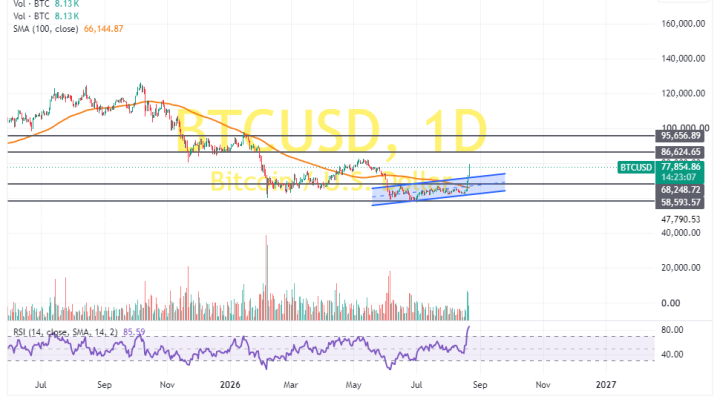
In the daily chart, the price of the pioneer cryptocurrency has recently completed an upward breakout from a sideways channel formation. The 14-day RSI also supports a long-term bullish bias after entering overbought conditions.
Therefore, the bulls will look to stretch the current spike towards $86,624 or higher to $95,656. On the other hand, the bears will look to pounce on pullbacks at about $68,248, or lower at $58,593.