
Crude oil long-term projection
This year world growth forecast and next year have been slashed and slowdown expected around the world. A trade war between the U.S and China regarded as one factor which contributes to the slowdown. Although the situation turns from bad to worse, crude oil still maintains gain this year. The price manages to stay above $50.00 handle but might be under pressure the rest of the year.
If the price move below $50.00 and the fundamental situation continue to deteriorate then it is possible that the price will erase all of the gains incurred this year.

Click here to see Oil July analysis
New Month
Monthly chart

The triangle consolidation of crude oil has not broken yet. The price continues traded inside the triangle and waiting for a trigger to move out of the range. This month, crude oil tumbled and tested June low before launched upward. At the current time, the price traded near the opening level and might close the month flat.
Weekly chart
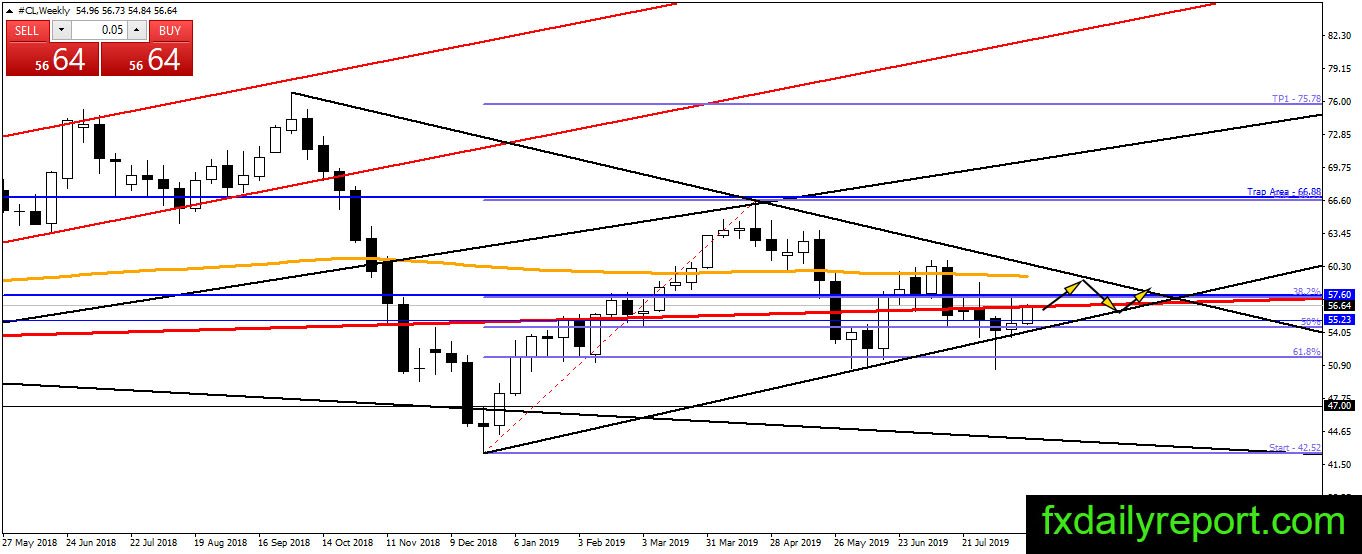

Crude oil moved lower and tested the bottom of the triangle before bounced from it. No close outside of the triangle range which suggest crude oil will continue the consolidation inside the triangle. Traders will continue to use the range and trade the range until breakout happens.
Daily chart

We have a bearish channel on crude oil daily chart. The price steadily moves lower inside the channel with lower highs and lower low printed. At the current time, the price attempting to breakout above the top of the channel. Above the channel, there is daily SMA 200 which should continue to limit the price movement. It is better to look for short positions and enter when there is a bearish reaction.
Trade plan
On the long-term time frame, crude oil nearing the end of a triangle consolidation. In several months, we should see a breakout of the triangle. Traders could prepare and trade the direction of the breakout. At the current time, both long-term and short-term pointed downward, but the medium-term chart shows us possible bullish movement.