
Crude oil long-term projection
The prospect of economic recovery helped commodities instrument to gain ground. Crude oil prices recovery has brought the price to the $45.00 level and set to continue further higher. Coronavirus vaccine also starts to roll out and vaccination is in progress. If the vaccines proved effective to end the coronavirus infection then the market could rally harder.
Crude oil prices currently experience buying as recovery expectation shrouding the market. Only if the sentiment change that it could influence the crude oil prices current bullish direction.
New Month
Monthly chart


Crude oil recovery currently reaches the level near $47.00 or 61.8% Fibonacci retracement. A close above the level will bring the price higher to test the monthly SMA 200 and $57.60 resistance level. If a major bearish reversal will happen then it might happen at $47.00. Traders might want to observe closely the reaction near the level.
Weekly chart
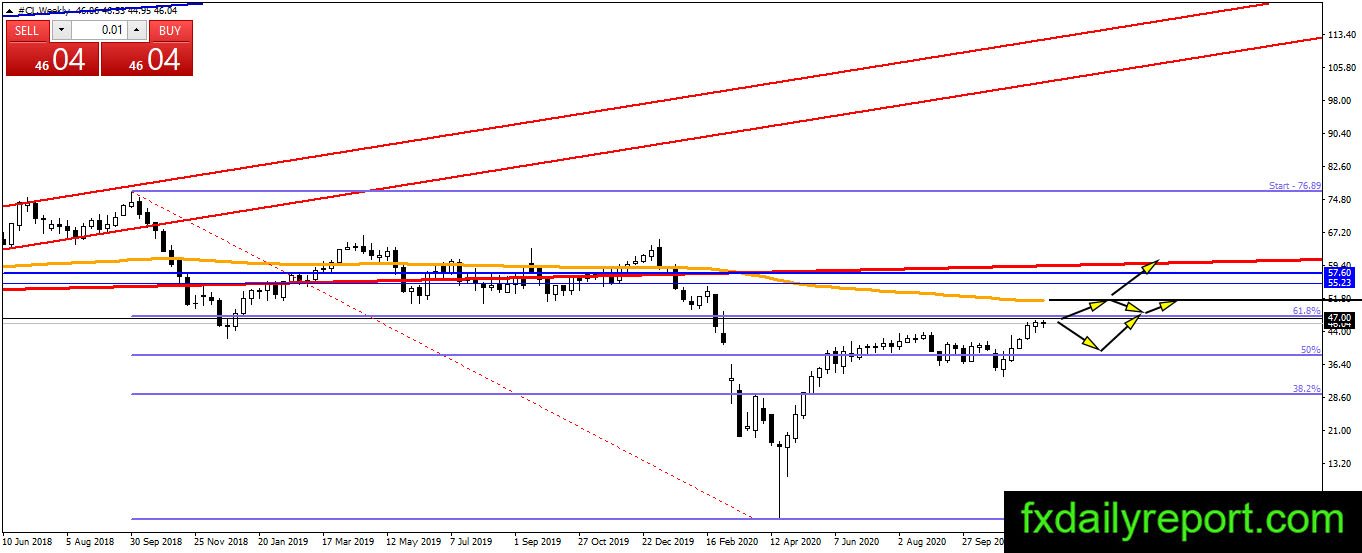
Crude oil prices made fifth consecutive weekly bullish closes. The price continues moving higher and is currently set to test the $47.00 handle. We might see a bearish reaction from the resistance level. Above the $47.00 resistance, there is a weekly SMA 200 to watch too. A bullish close above both levels needed to confirm the bullish continuation.
Daily chart

The overall situation is the same as in the weekly chart. In the previous upward movement, the March gap has been closed. If there is bearish movement then the gap level and the daily SMA 200 could be used as support levels.
Trade plan
Crude oil prices bullish recovery soon will challenge the $47.00 or the 61.8% Fibonacci retracement level. It is time to wait sideline and see the price reaction near the resistance level. If a bullish breakout happens then traders who have long positions could continue to hold the positions.
If a bearish correction happens then the daily SMA 200 and the March gap level could be used as support levels to add more long positions.