
Crude oil escaping bearish zone
Crude oil show gloomy outlook in June as the market loss optimism under oversupply condition. Fortunately, entering July, there was a revision on U.S future oil production. The government revised down 2018 projection and slashed it from 680,000 bpd to 570,000 bpd yoy. This is good news for crude oil bull as it might lift some weight on oversupply problem.
Even though it shows some bullish sign, the price of crude oil still lower below $50 and need to move up above it soon. We expect the price might stabilize between $45 – $52 in the second-half of 2017.

Click here to see Oil June analysis
New Month
Monthly chart

Crude oil halted decline on the monthly chart and the price currently moving up above July opening price. Bullish close in this month could trigger more buying toward $50 handle. The declining trend in U.S crude oil inventory also helped the bull.
Weekly chart
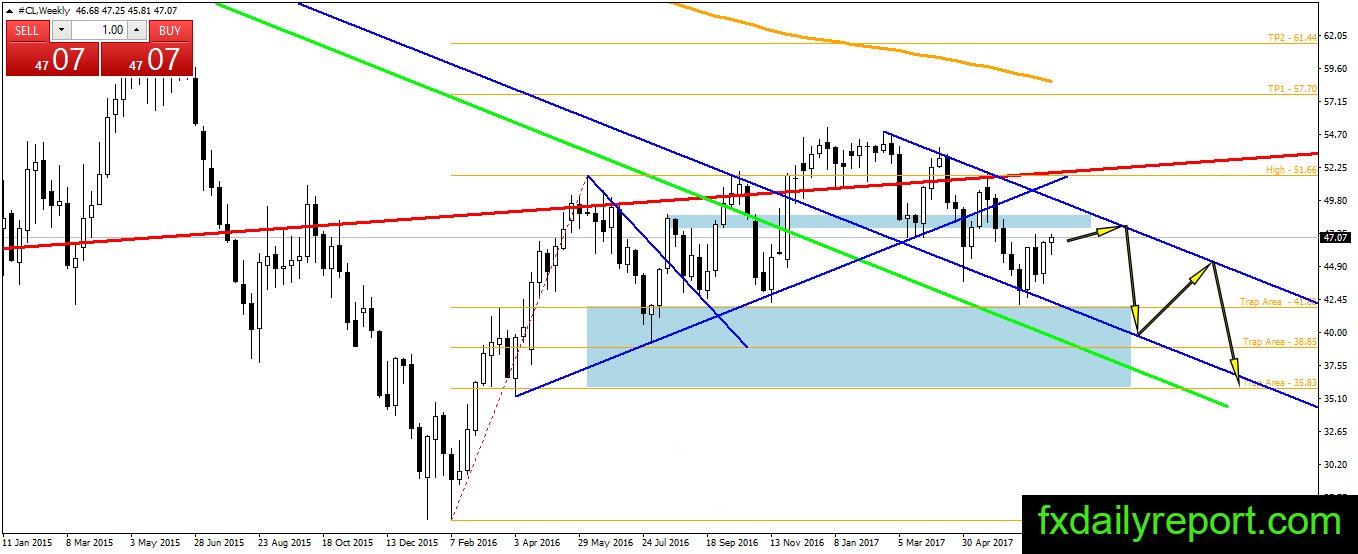
The bearish trend on weekly chart stay intact, and the price of crude oil currently undergo upward correction after the bounce from the bottom of the channel. The price has target between $47.00 – $49.00 or the top of the bearish channel. Traders could look for the short position if the price rejected from the resistance.
Daily chart

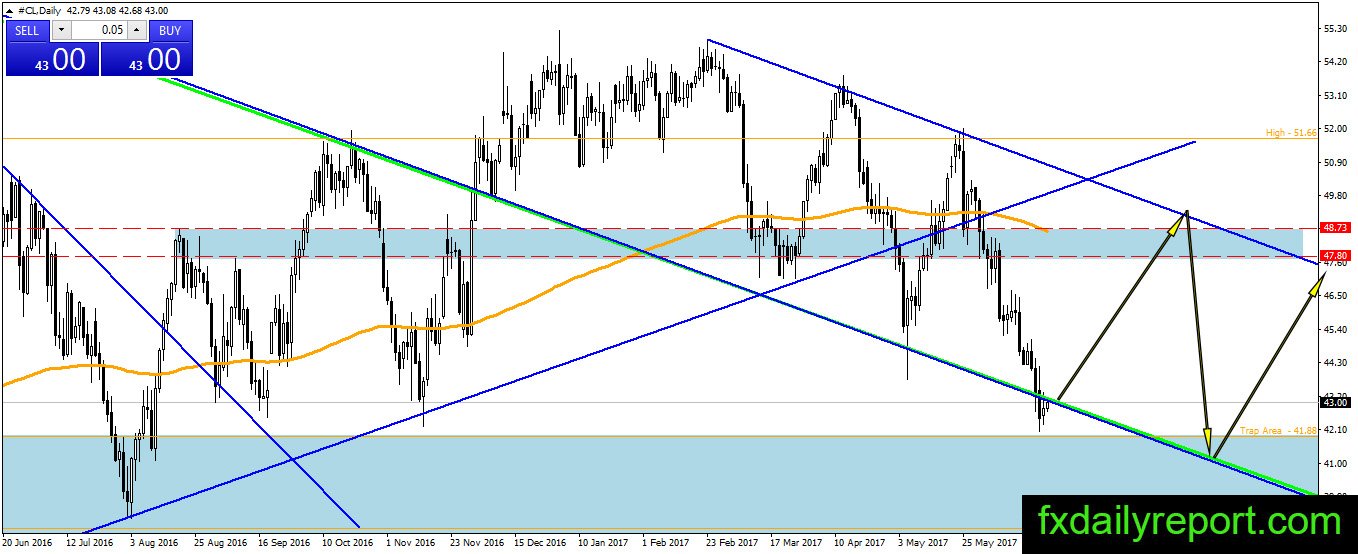
The daily chart is the most interesting chart out of three. In the previous analysis, we mention about bounce from the bottom of the channel with the target at the blue area or the top of the channel. It looks like the price limited below $47.00 in the first attempt. Currently, the price back near $47.00 and might be able to breach it.
Trade plan
Bullish trade: Long position need to wait until $47.00 broken and tested
Bearish trade: Short position could be taken if the price rejected from the blue area ($48.00 – $49.00) or the top of the blue channel.