
Crude oil long-term projection
OPEC pledged to cut production helped crude oil prices to recover. The reopening of the economy around the world also deemed successful initially. However, the number of coronavirus cases surge and might put the reopening of economy to a halt.
These 1-2 months will become vital for the world economy. If the new coronavirus cases could not be curb then optimism will start to wane and crude oil prices might start moving lower again. Currently, the price expected to trade sideways until further development.
New Month
Monthly chart


Crude oil prices crossed the $40.00 handle or the 50% Fibonacci Retracement level. The price has not moved much from the opening level this month. If the price could print higher high and close above previous month high then crude oil expected to target $47.00 then $50.00.
Weekly chart

On the weekly chart, the price gap has been closed and crude oil prices halted its upward movement. The price currently consolidating near the 50% Fibonacci Retracement. We might see some reaction soon in several weeks. As long as there is no major bearish reaction, crude oil might be able to continue its bullish corrective movement.
Daily chart
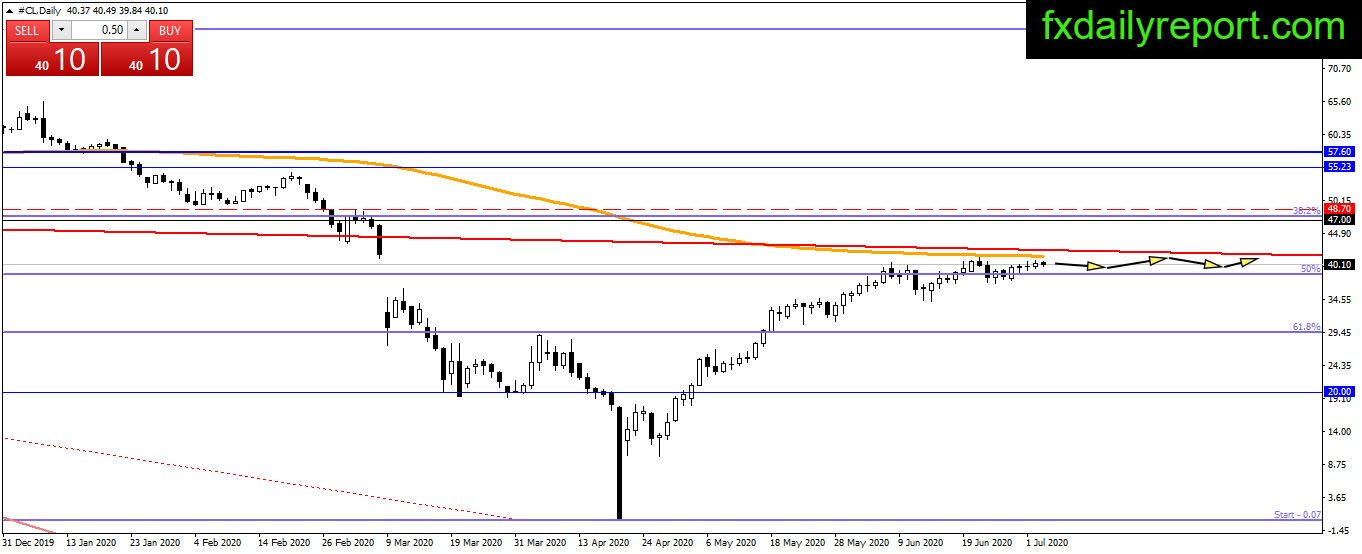
Crude oil bullish movement slowed near the daily SMA 200. We could see the price currently consolidating between the 50% Fibonacci Retracement and the daily SMA 200. No major clue yet where the price will move next. Traders will continue waiting for reaction near both levels at the current time.
Trade plan
Crude oil bullish correction has closed the gap level created when it fell sharply before. The upward movement seems to lose bullish momentum but no apparent bearish reaction yet. At the current time, the situation is unclear. Traders might want to continuously monitor the price reaction between daily SMA 200 and the 50% Fibonacci Retracement level.