
Crude oil bullish but hit resistance
Crude oil rode a strong wind upside in September and closed the month at $51.63 back above $50.00. The upside strength mostly triggered by multiple Hurricane strikes on U.S and nearby neighborhood. When this analysis is written, the price of crude oil moves back below $50.00 and closed at $49.20 on a weekly basis.
Recent EIA data show a wider deficit of 6.0 million barrels compared to the deficit of 0.5 million barrels expectation. The data release did not help the bull and analyst think the deficit might be for temporary. As the oil drilling operation resume after the hurricane, supply level should back to normal, and the price of crude oil will normalize.

Click here to see Oil September analysis
New Month
Monthly chart
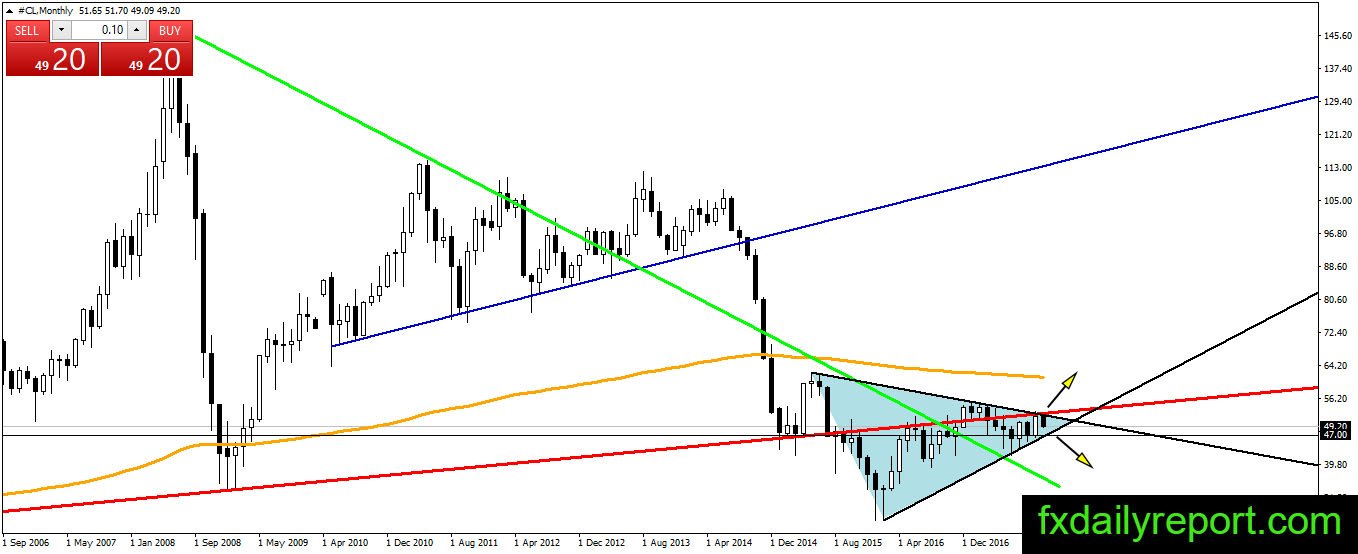
Crude oil compression continues on the monthly chart. The price trapped inside a triangle and bouncing up and down. There is no breakout yet and we forecast crude oil will move inside $47.00 – $51.70.
Weekly chart

Crude oil on the weekly chart has black trendline as the nearest support level. The downward movement might stop when the price hit level around $47.50 – $48.00. Bullish traders could look for a long position with target $50.00 – $51.30.
Daily chart

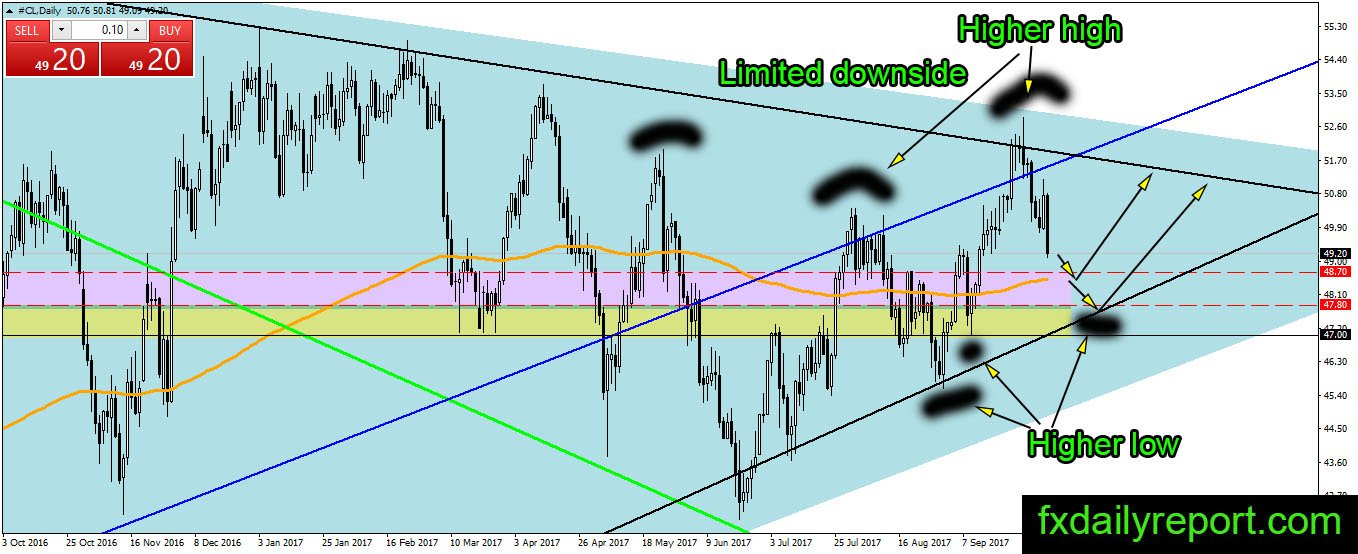
The downward movement of crude oil started after the price hit blue trendline and the black down trendline. The most encouraging outlook for the bull is the price manage to print higher high and higher low which is bullish. We project the price has limited downside and will see buyer around daily SMA 200 and $47.00 – $48.70 area.
Trade plan
Bullish trade: Traders could look for long position near the daily SMA 200 or between $47.00 – $48.70 area.
Bearish trade: Short position need to wait for the price reverse upside and touch the top of the triangle shown on the monthly and weekly chart.