
Crude oil shiny on supply shortage
The projection of OPEC inability to reach production target and trade wars incited by the U.S buoyed crude oil prices on the previous month. Previously OPEC collaborates with non-member to cap production and manage to bring the oil price higher. However, sanction on its member by U.S and crises in Venezuela opened a large hole in supply and the gap not easily met by all members.
Fundamentally, the price of crude oil will continue higher as long as the gap in supply not filled.

Click here to see Oil September analysis
New Month
Monthly chart
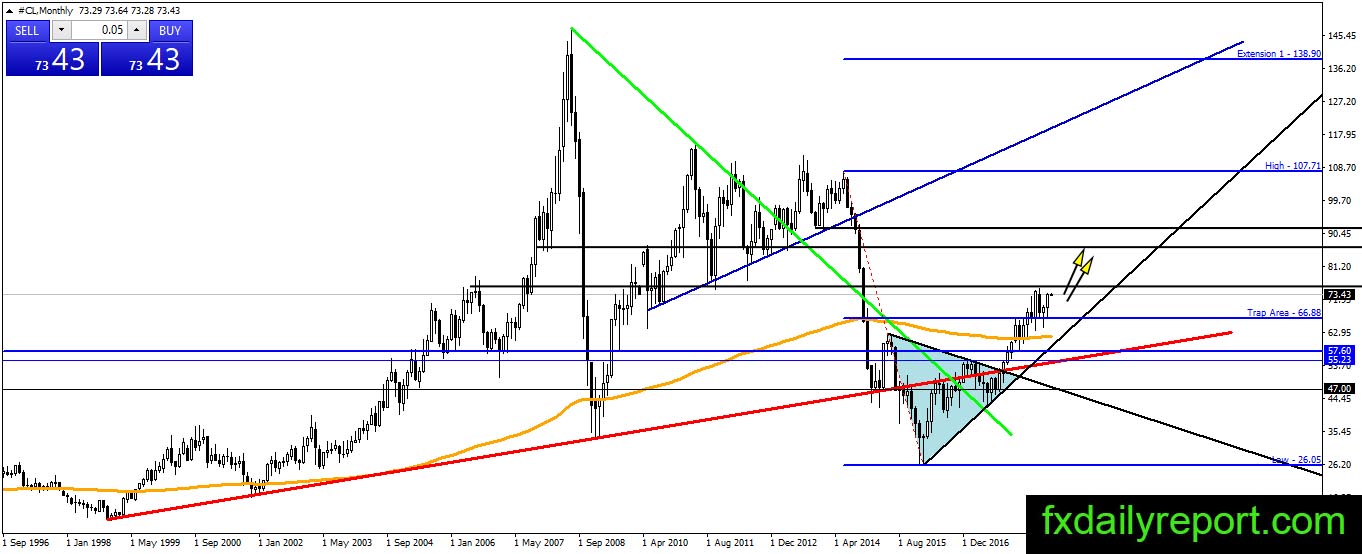
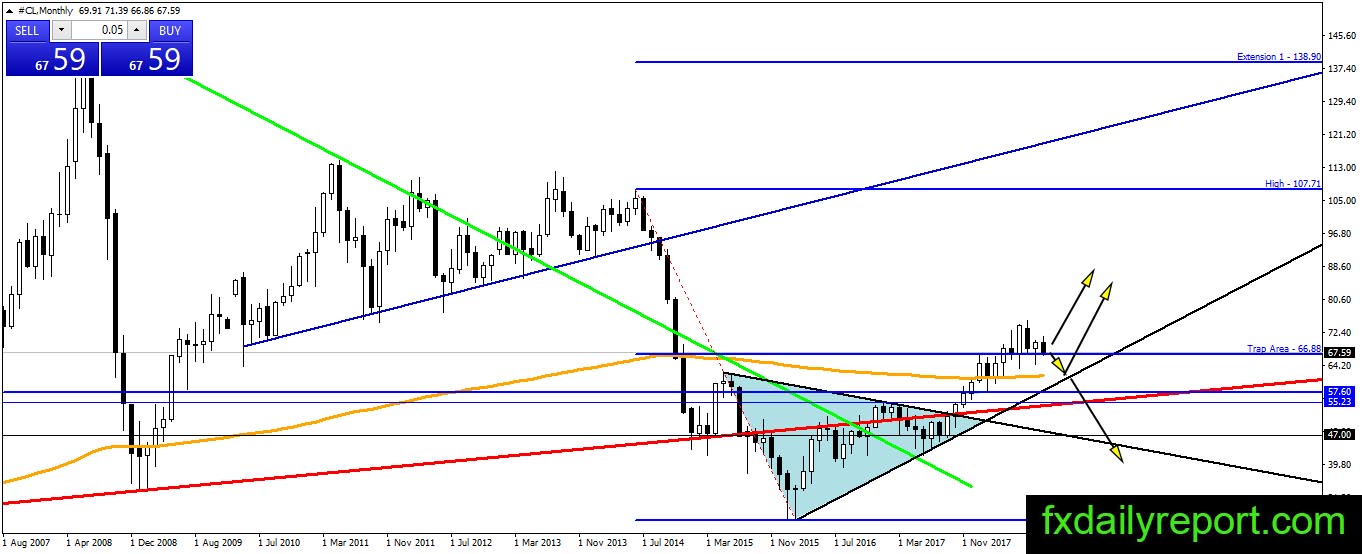
Crude oil launched upside above the Fibonacci 50% and opening the path upside to further the bullish trend. There is flip resistance around $75.00 and to the upside area between $85.00 – $92.50 will pose as the strong resistance area. If there is no change in the situation then we could expect crude oil breakout above $75.00 before the year-end.
Weekly chart
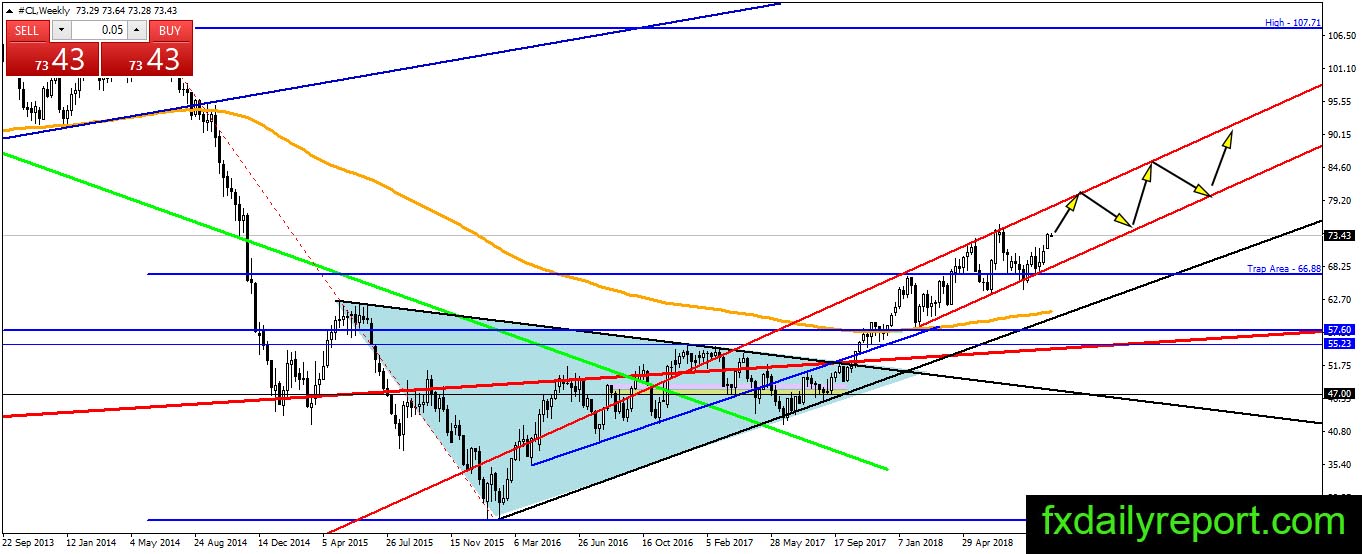
The weekly chart also shows the bullish situation and project crude oil movement inside the bullish channel. A long position is best taken when pullback near the bottom of channel happen. On the other hand, a short position best avoided under the current strong bullish situation.
Daily chart
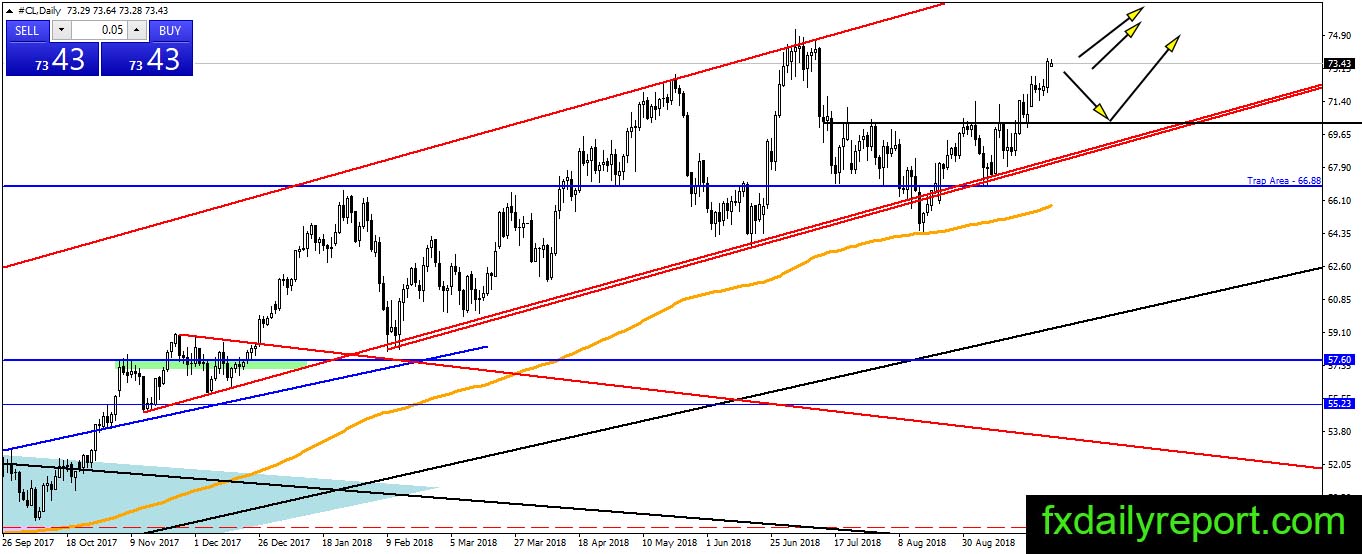
Crude oil on the daily chart is aligned with its weekly and monthly chart. The direction is upward and the only possible long position to take on the daily chart is when the price retrace to $70.00 support level.
Trade plan
Bullish trade: $70.00 and the bottom of the bullish channel shown on the weekly chart is the levels to watch.
Bearish trade: It is best to avoid a short position at the moment. However, $75.00 Is one of the best levels to look for weakness in crude oil.