
EBAY Long-term outlook

Holiday sales are the awaited moment of the year especially for the retailer such as EBAY, but weak demand and also common problem such as counterfeit products might hinder the company to become profitable. According to thecounterfeitreport.com they identified a total of 2.5 million counterfeit items on eBay and reported 1.8 million to eBay removal list.

Despite the threat of counterfeit product, recently there is a good sign the company will perform more as members of the companies are optimistic. We can see from the insider trades, and options exercised show most members accumulating shares.

New Month
Monthly chart
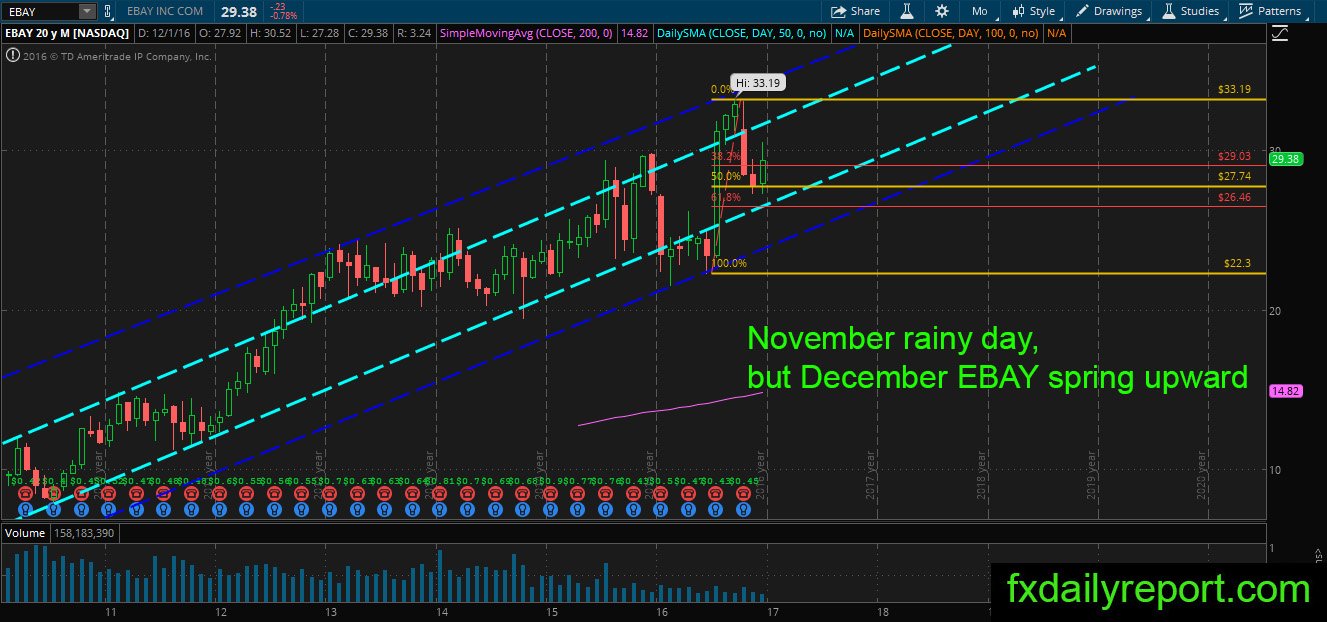
EBAY shares fell in November as Trump elected as President, the downward movement stalled near the 50% Fibonacci retracement level. Continuing into December, the bull seizes control from the bear and push the price higher. If the bull could close the price above November high $29.44, then it will form bullish engulfing candlestick and sign another rally in EBAY.
Weekly chart
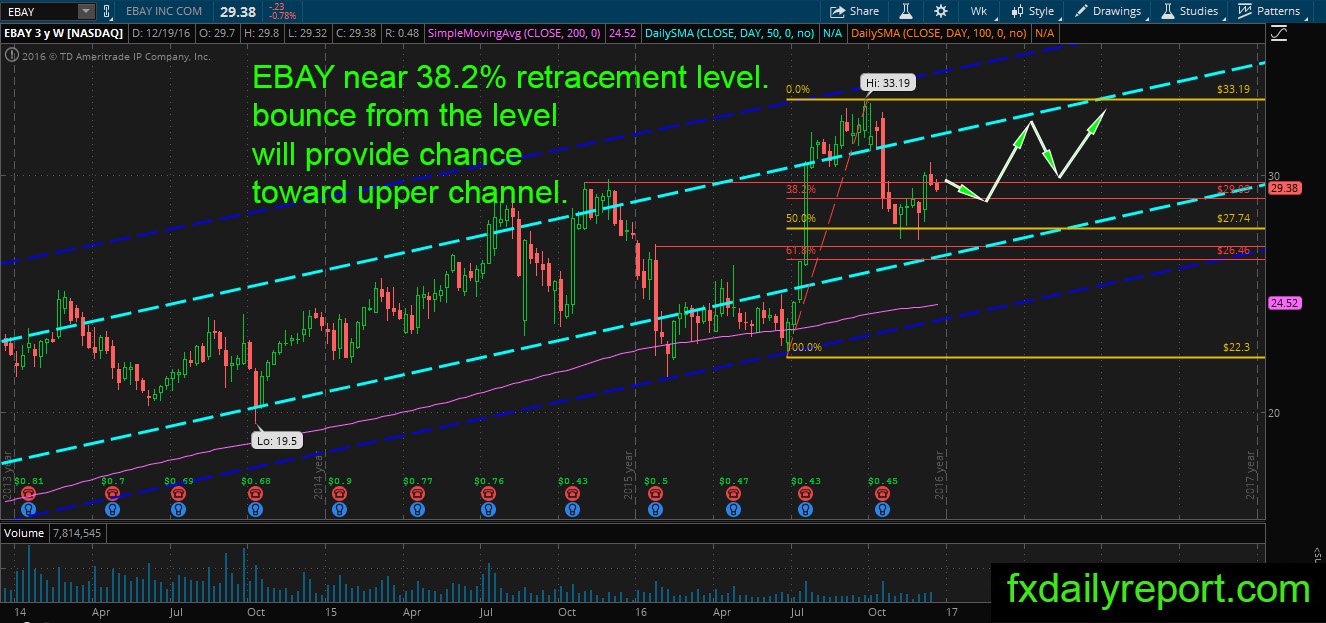
The bullish trend in weekly chart confirmed when the price closes above $29.44. Currently, the price is consolidating and looking for support near the 38.2% Fibonacci retracement level. If the price could bounce from the level, then it will open the upside chance toward the upper channel.
Daily chart
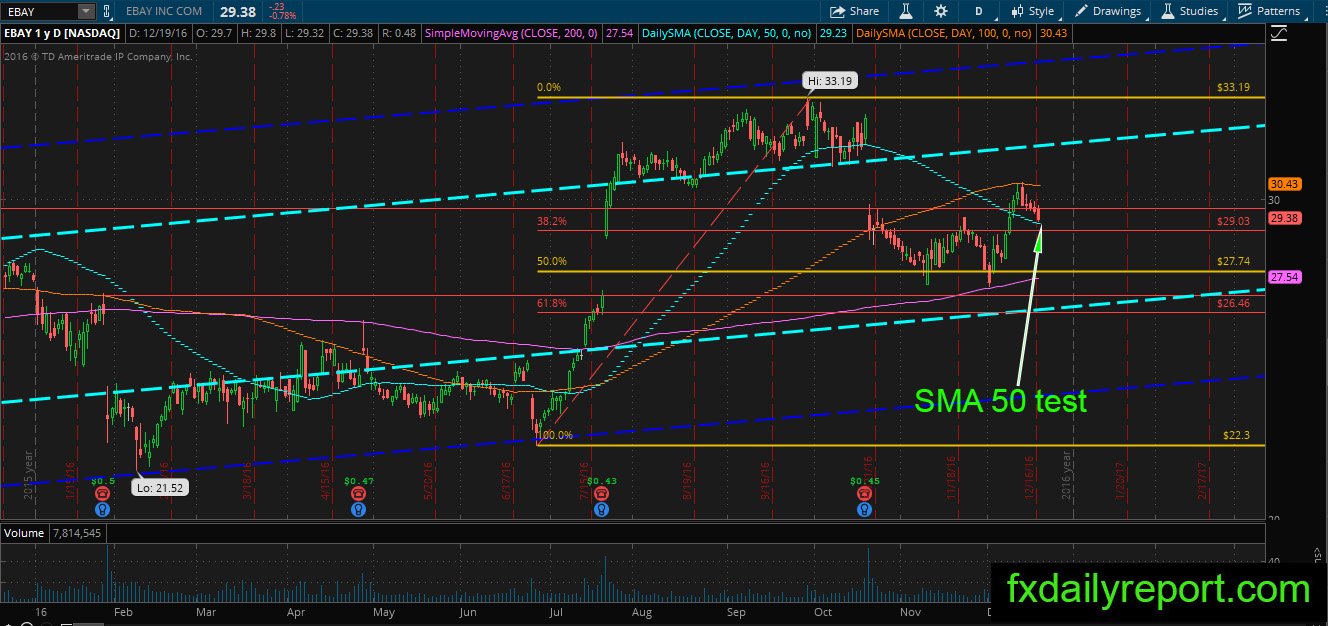
The short-term bullish trend also identified on the daily chart as EBAY bounce from its daily SMA 200. The price is testing the SMA 50, similar to the weekly chart, and we expect a bounce toward the blue channel to close previous earnings gap.
Trade plan
Long position placed between the SMA 50 and 38.2% Fibonacci retracement level is the first choice. Another, entry near the lower part of the blue channel or the 50% Fibonacci Retracement is another entry to consider.
The short position could be taken when the price closes the earnings gap or placed near the upper blue channel.