
EBAY Long-term outlook

EBAY is showing no sign of reversal, and the bull was busy pushing the share prices higher. At the end of September, EBAY closed at $38.46 and printed new record high in October at $39.28. However, the bull party seems nearing its end as the share prices slip lower to $37.29.

The company provides weaker outlook for the fourth quarter. EBAY expects fourth-quarter revenue between $2.58-$2.62 billion while consensus expects $2.60 billion. Earnings expected between 57 – 59 cents while consensus expects 59 cents.
Full-year revenue for revenue $9.53 – $9.57 billion vs. consensus $9.54 billion. Moreover, full-year EPS expected at $1.99 – $2.01 vs. consensus $2.01. Although the outlook is weaker, overall analysts optimistic on the company future growth and EBAY share prices could continue bullish.
Click to read EBAY previous analysis
New Month
Monthly chart
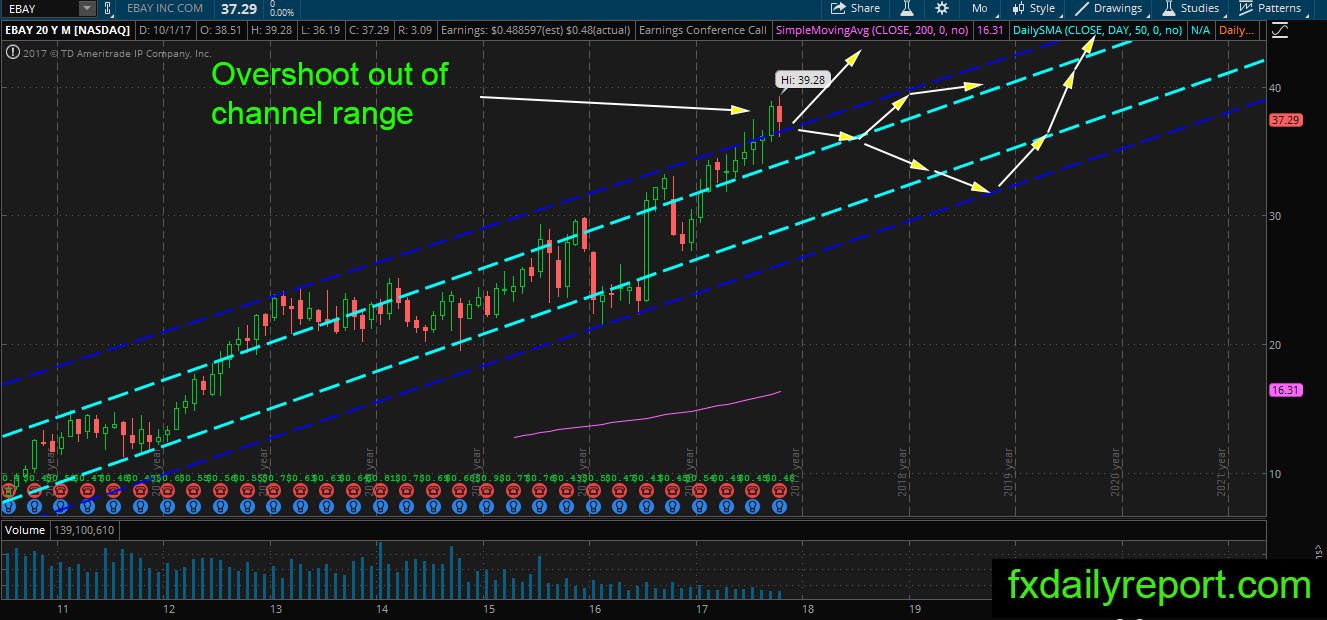
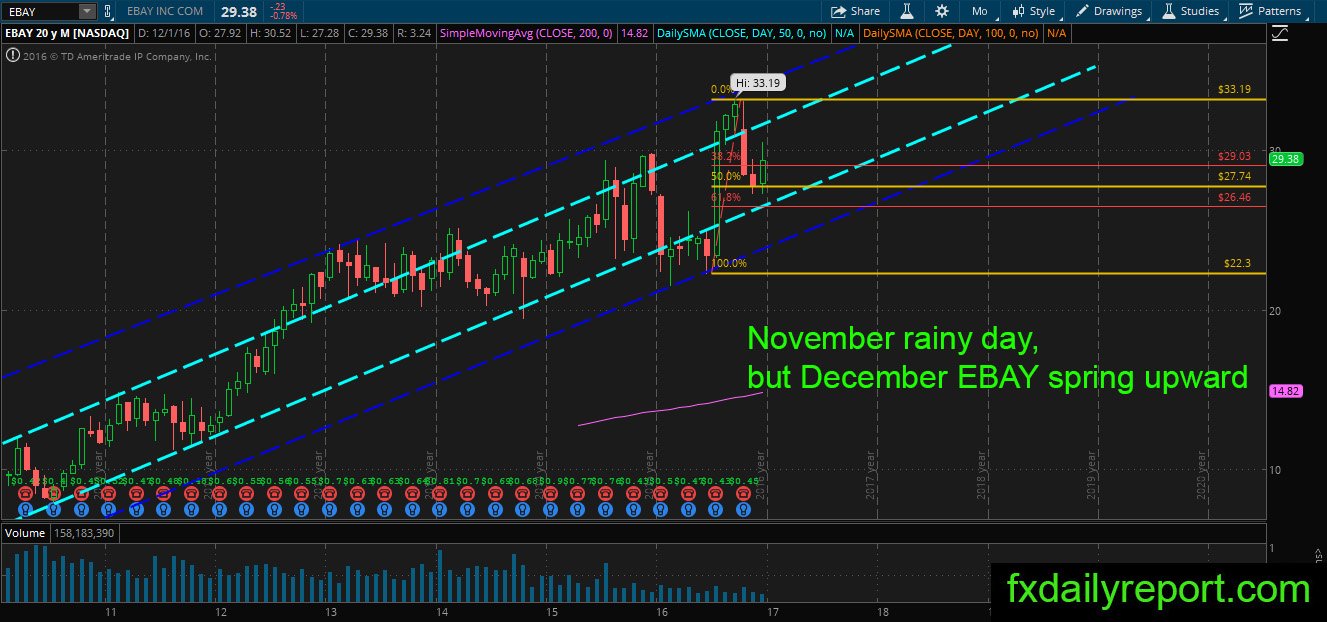
EBAY share prices are worth to watch as the bull buying pressure break above its channel range and produce overshoot condition. Normally, overshoot condition followed by normalization which could happen anytime on EBAY share prices. On October, the share prices move down and test the top of the blue channel. It is possible by the end of the month, EBAY return inside the channel range.
Weekly chart
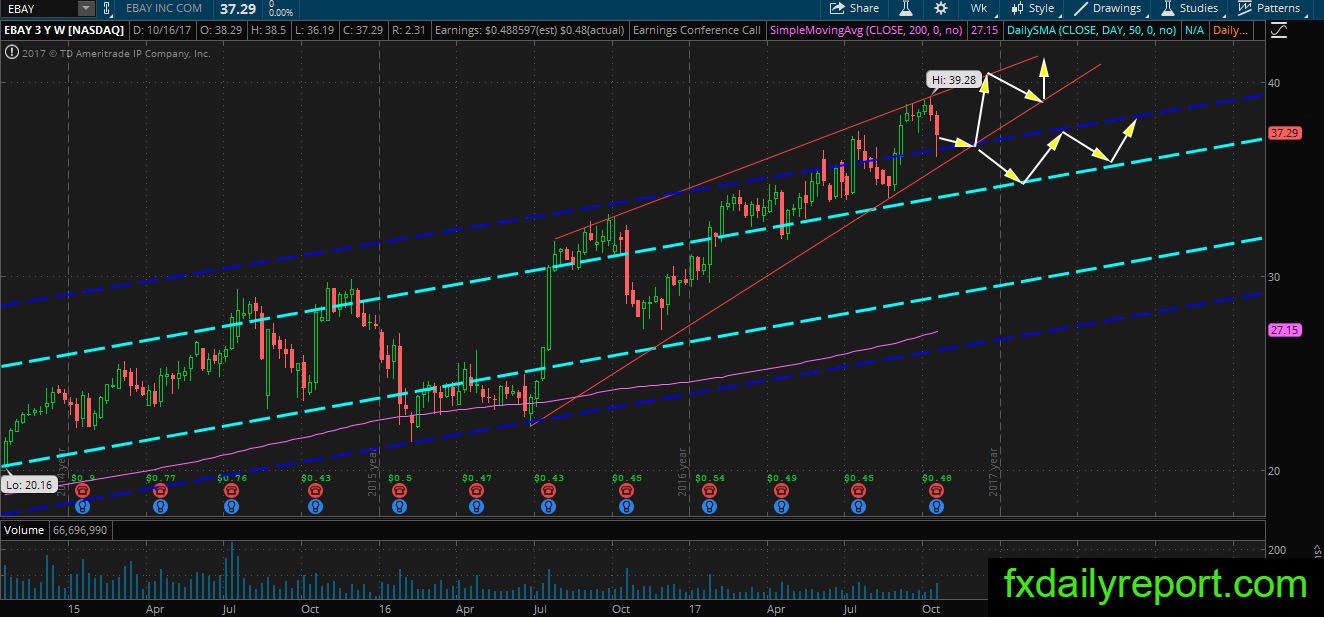
EBAY lower on the latest week after the company provided weak guidance for fourth quarter and full year. The downward movement being bought near the top of the blue channel and provide a chance for a bounce. There is no conclusion yet on the next move and the week has not closed yet. If EBAY sinks further below the red trendline, it will trade in a lower range between the top of blue and light blue channel.
Daily chart
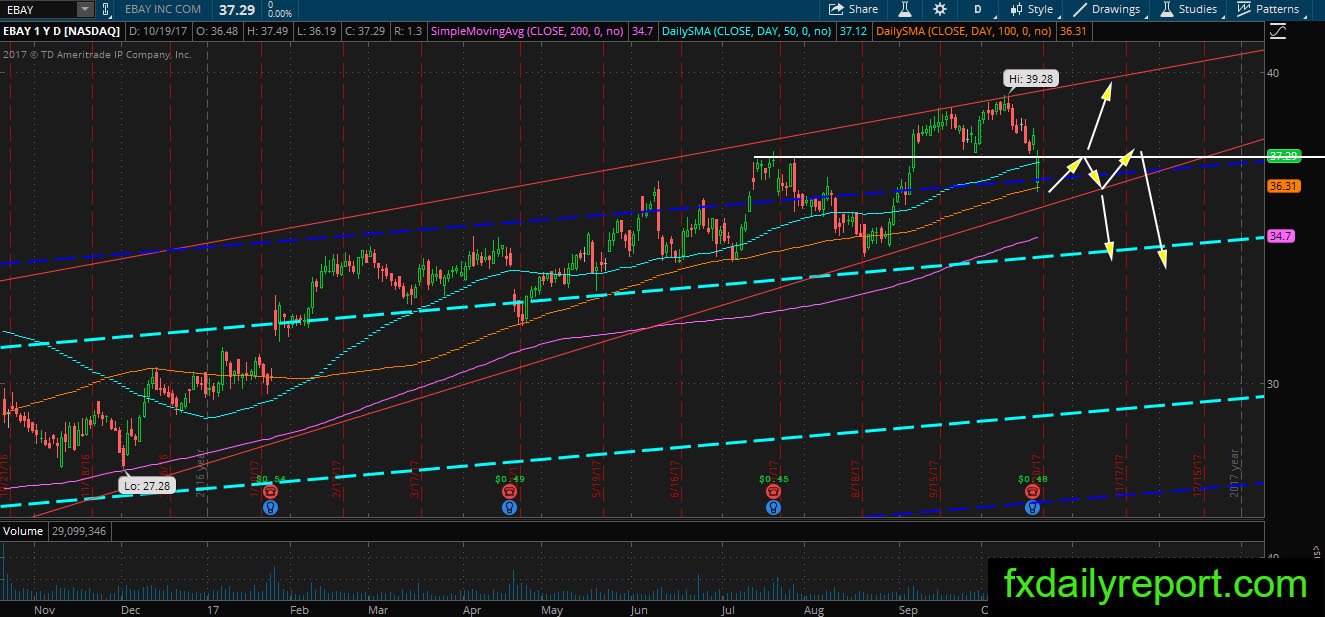
Zooming in the daily chart, the share prices gapped down on the earnings report, but immediately recover most of its loses. Overall, the share prices closed above daily SMA 50 and might cancel the selling pressure. We could see the bull came in near the daily SMA 100. Overall the trend stays bullish and no reason to sell EBAY yet.
Trade plan
A short-term long position could be taken near daily SMA 50. Traders could look for long-term long position near the top of the light blue channel or daily SMA 200.
The short position needs to wait until the share prices back below the blue channel.