
EUR/GBP long-term technical analysis
We are in a new year and EUR/GBP ready to kickstart the new year with another bullish trend? It is possible as the pair closed bullishly in the last month of 2017. Although it looks bullish, calculating the range and position of EUR/GBP closed at the end of 2017, we might say it is a fair result.
The pair traded between 0.8312 – 0.9305 in 2017 and closed at 0.8879. EUR/GBP gained 567 pips but released 43% of its gain in 2017. This year, Brexit will continue become the major influencer while ECB long-term stance also under observation.

Click here to read previous EUR/GBP long-term technical analysis
New Month
Monthly chart
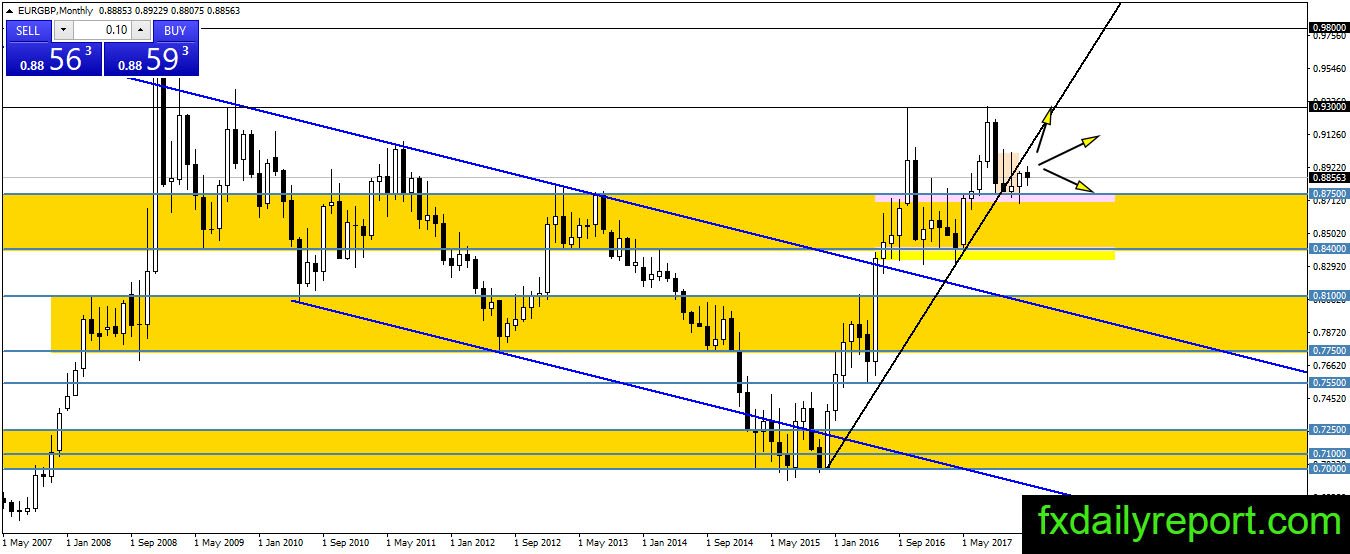
The close outside of the bullish trendline brought EUR/GBP traded sideways. The month December provided the bear time to test support 0.8750. Initially, it looks like the level would be broken, but the bull press “Stop” button and brought the pair up. December closed higher than November close, but there is no major bullish momentum yet.
This January, we might see a sideways movement in EUR/GBP.
Weekly chart
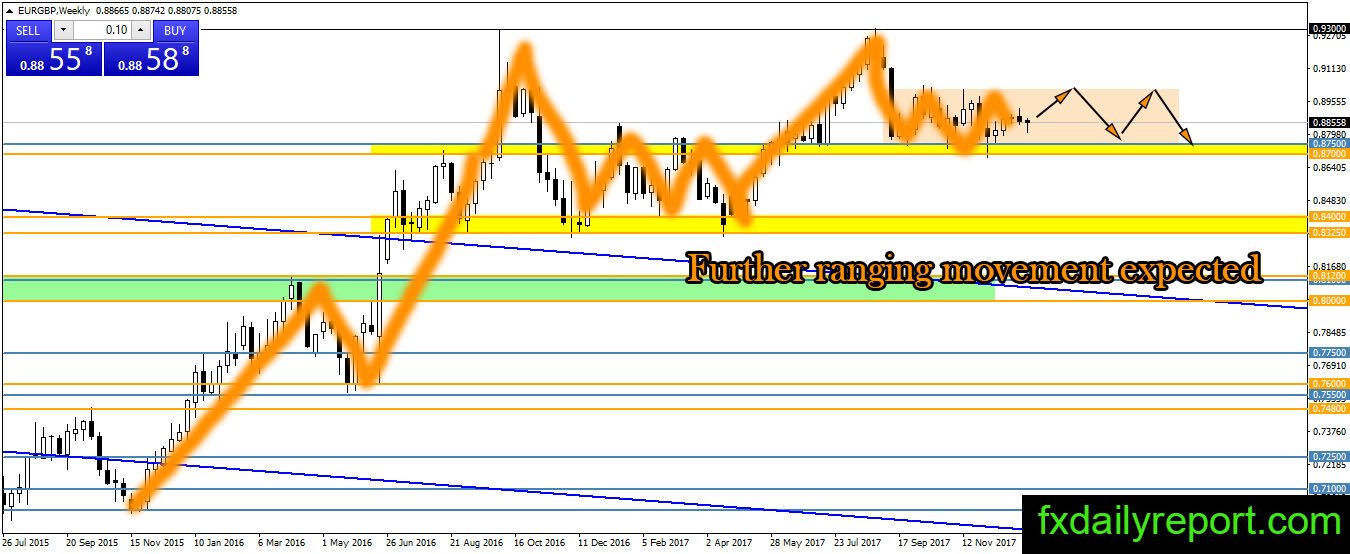
EUR/GBP might continue sideways on the weekly chart as the pair traded between 0.8750 – 0.9000. Traders could make use the range and trade both side until breakout happens. We favor long position more than the short position as the trend is bullish.
Daily chart
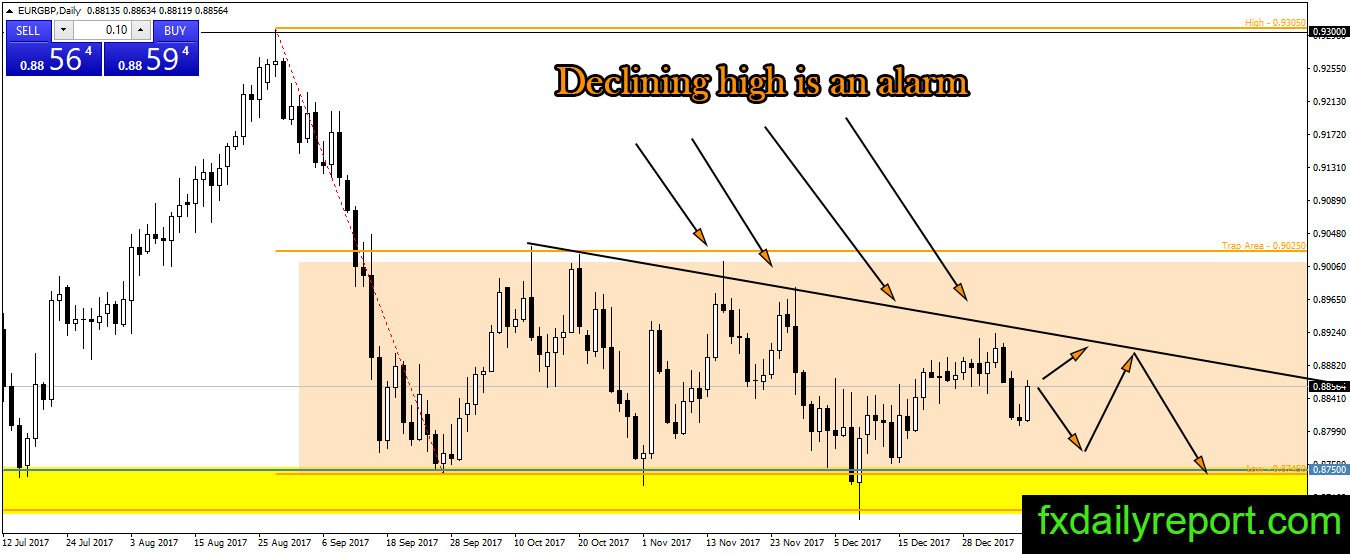
The trend on daily chart looks bearish following the declining high. However, it is a short-term trend opposite to EUR/GBP long-term trend which is bullish. A higher high above the trendline is needed by the bull to start a new upward movement.
Trade plan
Traders suggested trading the bisque color box range until breakout happens. Long position around 0.8750 – 0.8800 and short position around 0.8980 – 0.9020 might be the best scenario to consider. (Same scenario as Dec’17).