
EUR/JPY long-term technical analysis
2018 has been a bearish year for EUR/JPY as the pair fell from 135.39 to close at 125.57. The situation did not get better in 2019 as the pair drop sharply in the first and second trading day to as low as 118.75. It is triggered by AAPL warning on its revenue forecast caused by U.S-China trade war.
Overall, there is no bullish reason but the bull attempted to hold the pair from further downside and manage to close EUR/JPY near 125.00. In January, major change happens in the U.S The Fed. The central bank said they will be patient on future rate-hike. It is a dovish sentiment for U.S dollar but on the other hand bullish sentiment for equity market and risk-driven assets.

Under the current situation, EUR might gain and push against JPY. Traders will watch development in the UK on Brexit and U.S-China trade deals to determine next long-term trend.
Click here to see previous EUR/JPY long-term technical analysis January 2019
New Month
Monthly Chart

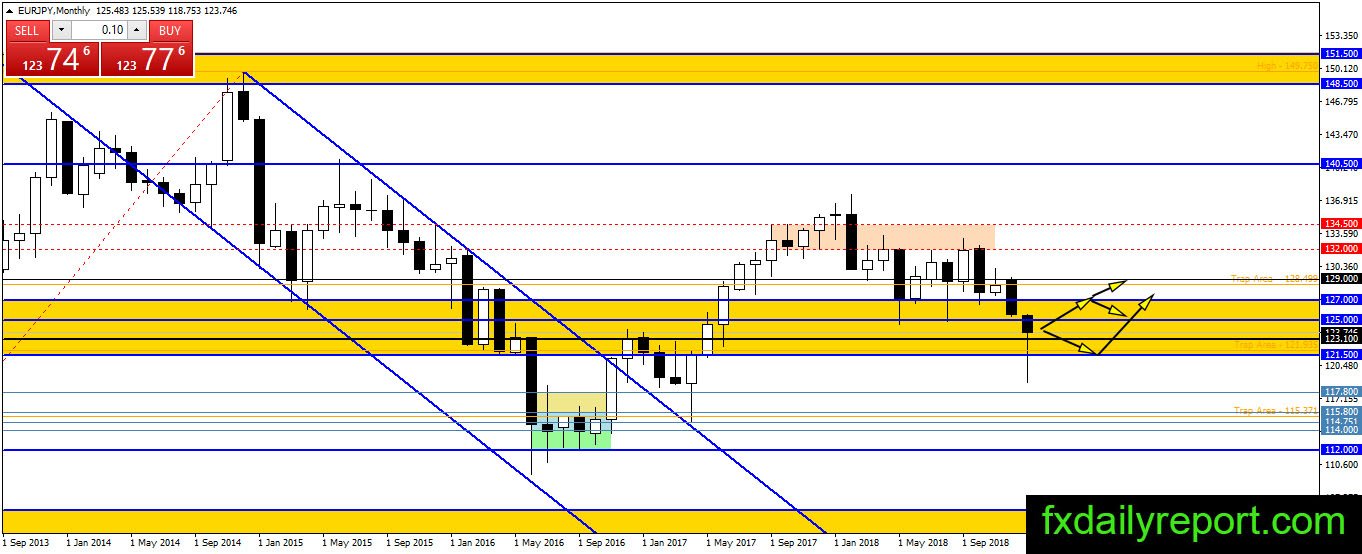
EUR/JPY dropped hard below 125.00 in the previous month to as low as 118.75. But, the bull emerges and push the pair up to close at 124.59. We could regard this event as a false breakout event and expect a more bullish reaction. Currently, the bull is in control at the start of February and challenging January high. A breakout and close above the high might trigger new bullish leg.
On the upside, 127.00 and 129.00 are the resistances to watch.
Weekly Chart
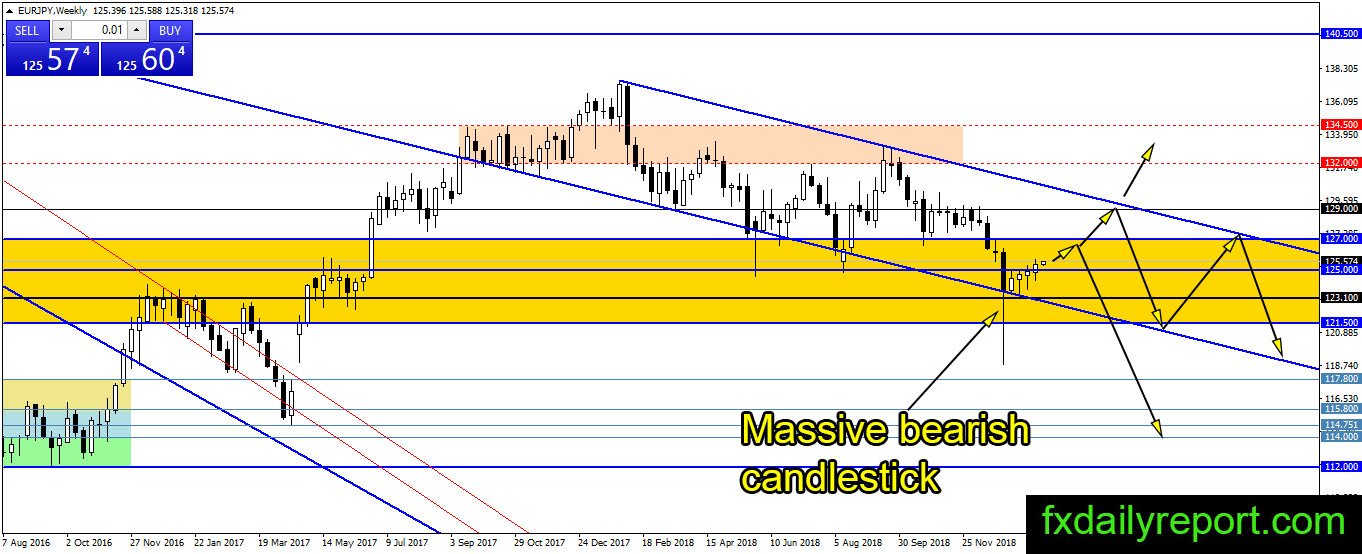
Overall situation on EUR/JPY weekly chart is bearish and no change to the situation. The pair is trading inside the bearish channel and previously experienced sharp selling below the bottom of the channel. However, the bull manages to close the pair inside the channel before weekly close. Currently, bullish correction happens and entered the fifth weeks. The correction has not surpassed massive bearish candlestick shown on the chart.
We think the upward movement might not last and high of the massive bearish candlestick and 127.00 will become the major challenge for the bull.
Daily Chart
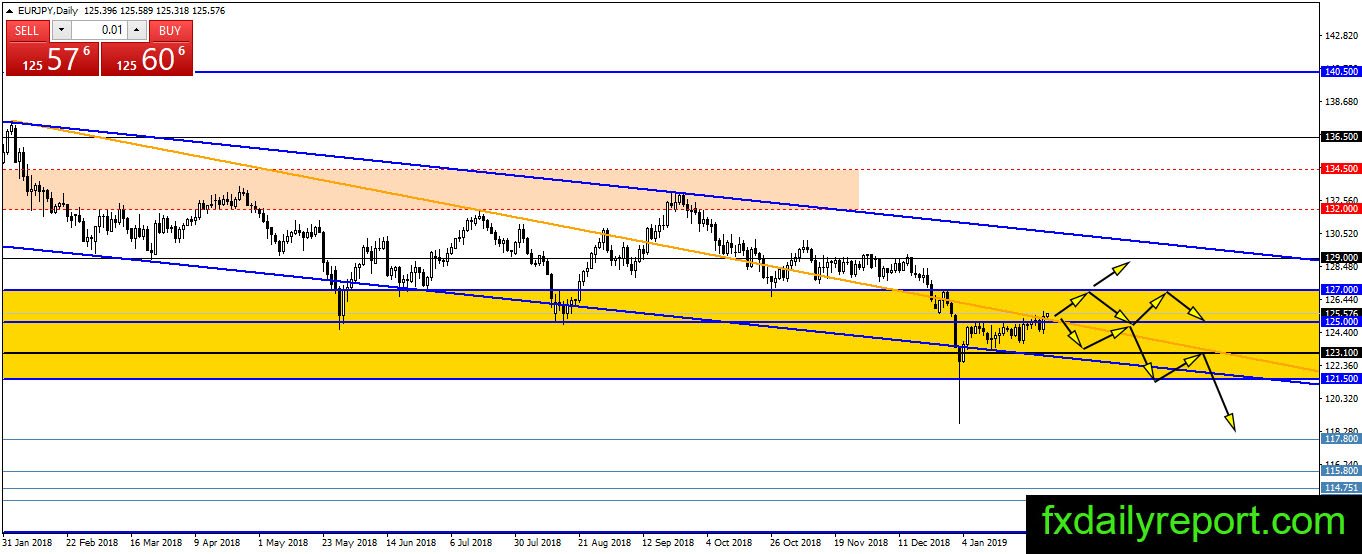
EUR/JPY traded between 123.10 – 125.00 after the sharp drop at the beginning of January. Currently, the pair climbs above 125.00 the first time in February and might continue upward slowly. The upside target for current bullish movement is 127.00.
Trade plan
Short positions could be taken from the resistance 127.00 when the pair has the chance to reach the level.
A long position needs to wait for a retest on 125.00.