
EUR/USD long-term technical analysis
EUR/USD might shine in December trading month but it will depend on the Fed and ECB result. Recently, The Fed sounded dovish in its statement and the minutes of the meeting. The dovish tone creates a bearish situation for U.S dollar and we could see currencies across the world advancing against the greenback.
The situation happens near the end of November which is no indication seen on the EUR/USD chart yet. We have similar open and close level for November after whipsawing movement. At this moment no clue yet for EUR/USD next movement.

ECB expected to end its QE this month and ready for rate normalization. The Fed, on the other hand, signaling the neutral rate is closer than expected. If both event move as expected then we could have EUR/USD heading higher this month.
Click here to see EUR/USD long-term analysis October 2018
New Month
Monthly chart
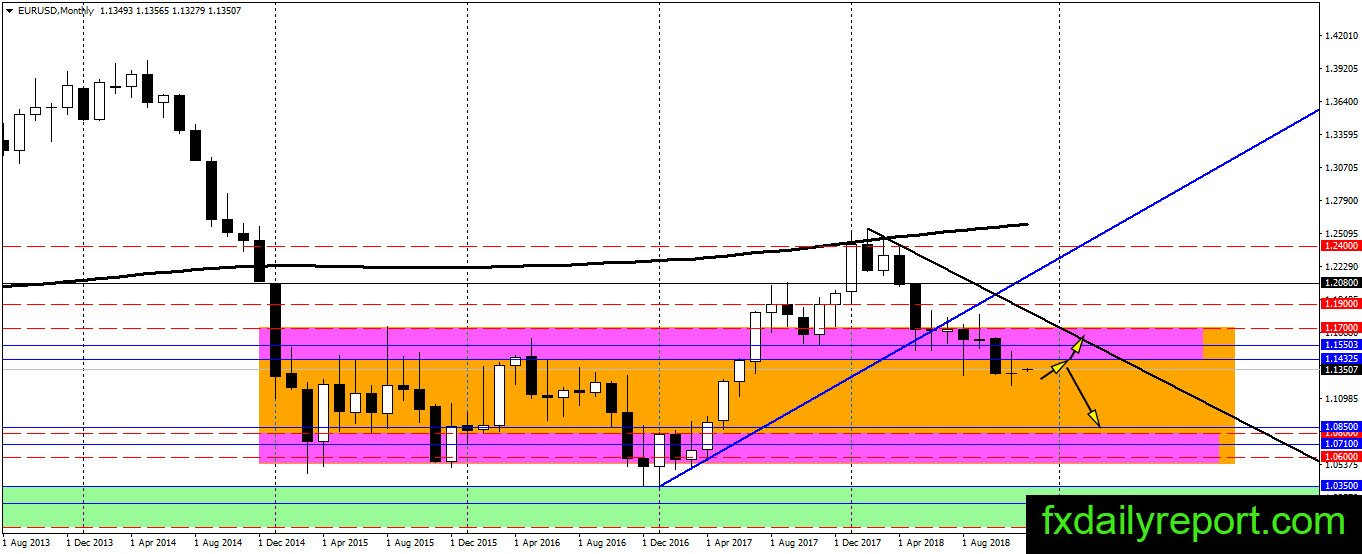
EUR/USD closure below the purple area was a major blow for the bull as it could sign the weakness in the pair will continue. There is an attempt in November to bring the pair back inside the purple area but rejection happen near 1.1500 and the pair closed near its opening level. This month, we might see another test on the resistance. Will we see a close inside the purple area? Alternatively, will we see another rejection from the resistance?
Weekly chart
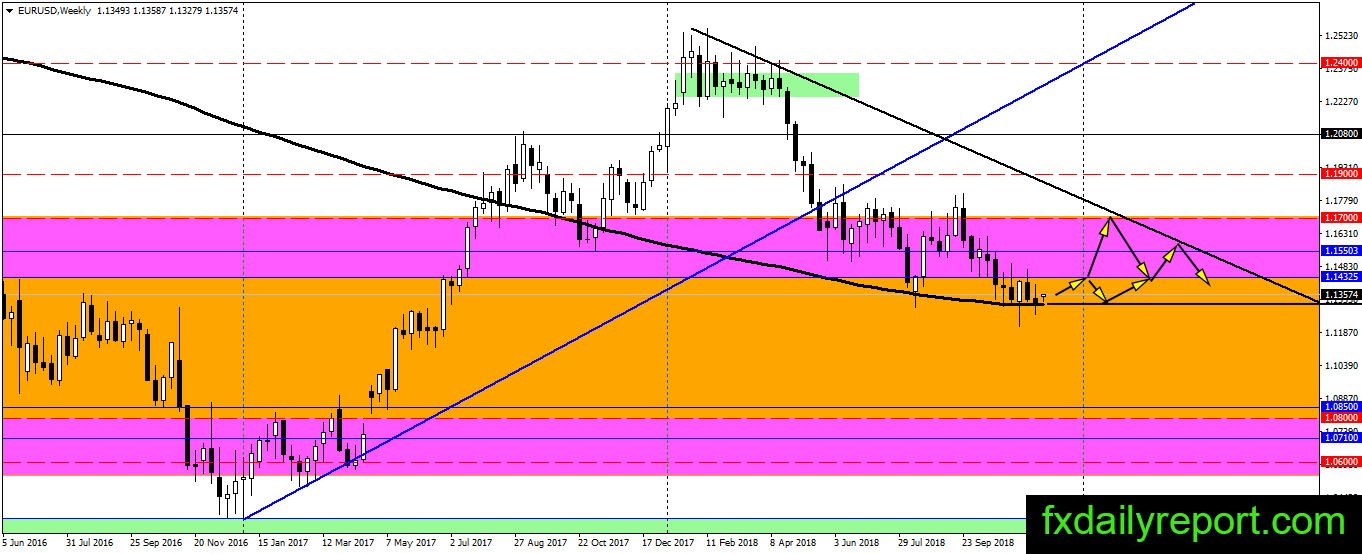
Despite the breakout on the monthly chart, we could see the bull still fighting a hard battle on the weekly chart. The pair supported at the weekly SMA 200 and looking to break out inside the purple area. It is either a close below the WSMA 200 or above 1.14325 which will trigger next trending movement.
Daily chart
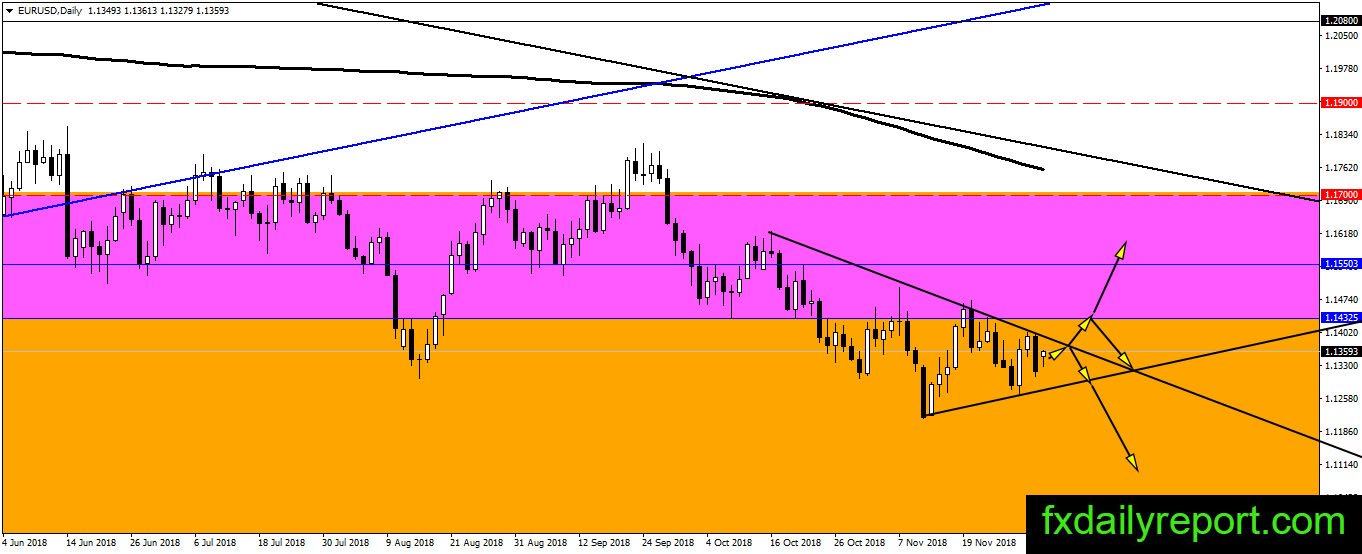
The overall trend on the EUR/USD daily chart is sideways. The market seems to wait for either ECB and The Fed interest-rate to determine next movement. Because of the triangle range, it is better to trade the range or waiting for sideline for now.
Trade plan
We are waiting for ECB and The Fed this month and there is the short-term and long-term scenario.
The short-term scenario is trading the breakout of triangle range on the daily chart. It could happen either way, but we favor the bullish scenario as there is a shift in the fundamental situation.
Long-term scenario is waiting for either a close below WSMA 200 or a close inside the purple area. (Next month)