
EUR/USD long-term technical analysis
The Fed gave the market dovish outlook on December 2018 and the latest outlook from The Fed turn more dovish compared to last year. Currently, the Fed does not expect to raise interest-rate anymore and the market expects the central bank will turn to rate-cut. Recent analysis also pointed out that the U.S might enter new recession by the end of the year as rate-yield turn inverted.
Meanwhile, from Eurozone, the main issue for this year is Brexit and slowdown in the economy. ECB might restart loose monetary policy again this year.

Click here to see EUR/USD long-term analysis February 2019
New Month
Monthly chart

EUR/USD has maintained closes above 1.1300 for several months but it seems the bearish pressure gradually push the pair lower. There was lower low printed in the previous month and this month the bear managed to print another lower low. If EUR/USD closed the month below 1.1300 then it might be the time for EUR/USD to resume the bearish trend.
Weekly chart
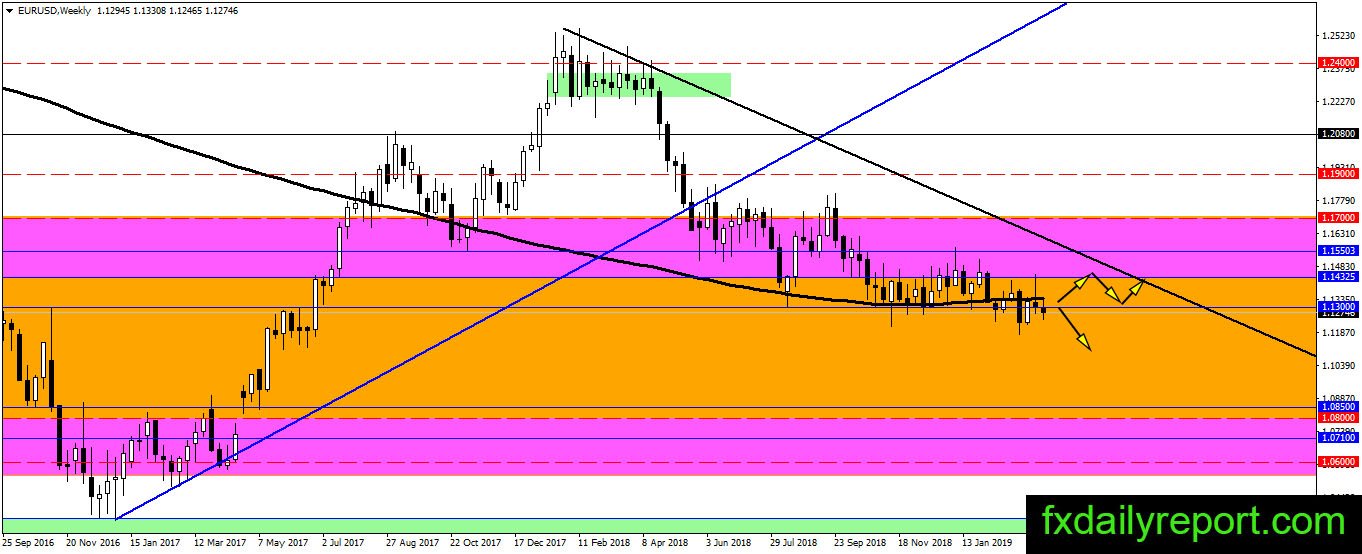
The overall movement of EUR/USD on the weekly chart is neutral as the pair trading at the weekly SMA 200. However, the high and low of EUR/USD gradually turn lower. We might see a decisive movement from WSMA 200 soon.
Daily chart
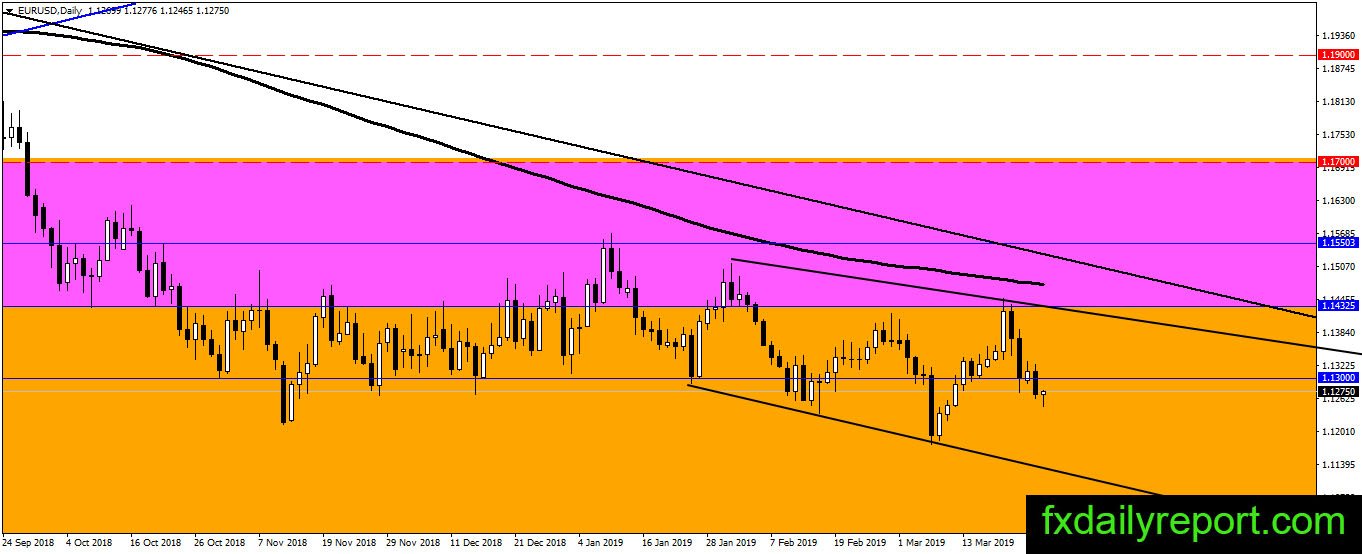
The direction on the EUR/USD daily chart is bearish and nothing changed yet. In the latest upswing, the bull manages to print a higher high. If the bull could print a higher and follow through with another higher high then it is possible for EUR/USD to start a new bullish leg. SMA 200 will become the key if EUR/USD managed to move higher.
Trade plan
No conclusion yet on EUR/USD next movement, 1.1300 play a major key on the monthly chart. Currently, the pair fall below the level and might close the month below it. A close below the level will trigger further selling and traders could use 1.1300 as the level to take short positions.