
EUR/JPY

EUR/JPY broke out above the triangle pattern, which suggest continuation of bullish trend. However, the situation immediately changed again as the pair turned lower and make a close inside the triangle area. It is a fake bullish breakout and now the bull is under big risk. Most of the time, the price will attempt to sweep lower and pushed the trapped bull out of the market. Traders will expect a test on the bottom of the triangle and possible breakout to clear stop order.

Today’s critical levels to watch:
Support: 160.00, 155.00, 154.00
Resistance: 163.00, 165.00
EUR/GBP
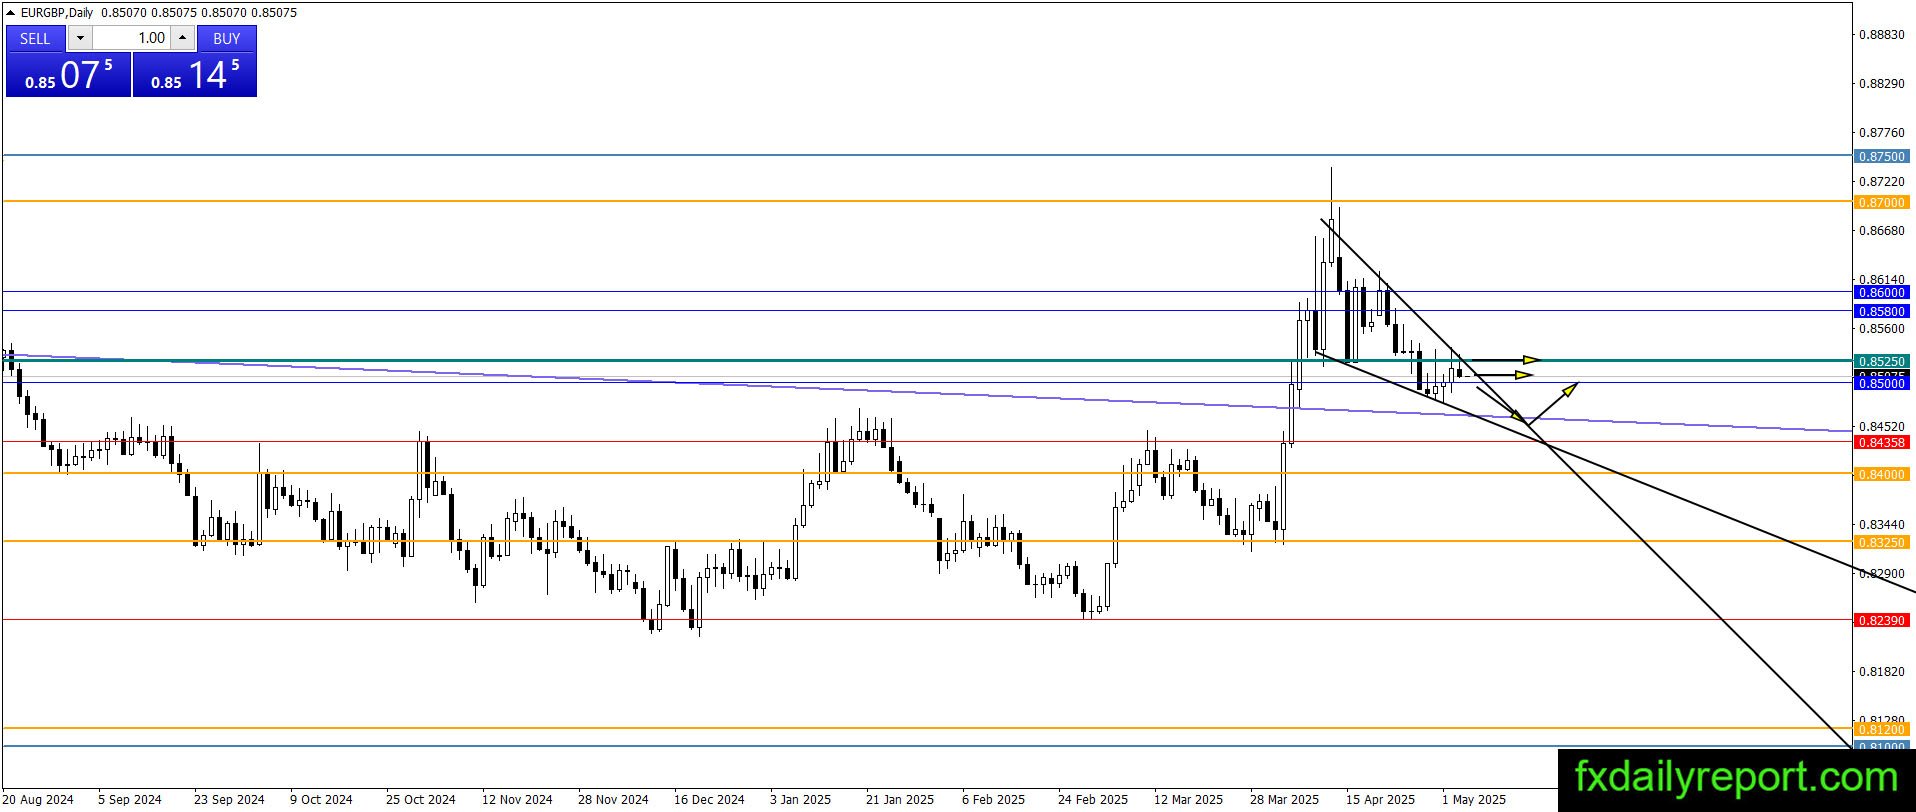
EUR/GBP formed a bullish flag or falling wedge pattern on the chart. It is a bullish pattern, and a breakout above the pattern will confirm bullish continuation. On the upside, we still expect the pair to target 0.8700. Despite the situation, there is potential the pair could continue moving lower until 0.8400 – 0.8430 before turning upward. A new lower swing low will cancel the outlook.
Today’s critical levels to watch:
Support: 0.8430, 0.8400
Resistance: 0.8500 , 0.8530, 0.8580, 0.8600, 0.8700, 0.8750
GBP/JPY

GBP/JPY turned lower after it touched the 193.50 resistance level. The situation is as expected as the pair trading between 188.00 – 193.50 area and the two trend lines. Traders will continue use the range to apply range trading strategies. Or traders could wait until the breakout and close outside the range happen to get confirmation on the next direction.
Today’s Critical level to watch:
Support: 190.00, 188.00
Resistance: 193.50, 195.00
GBP/CHF
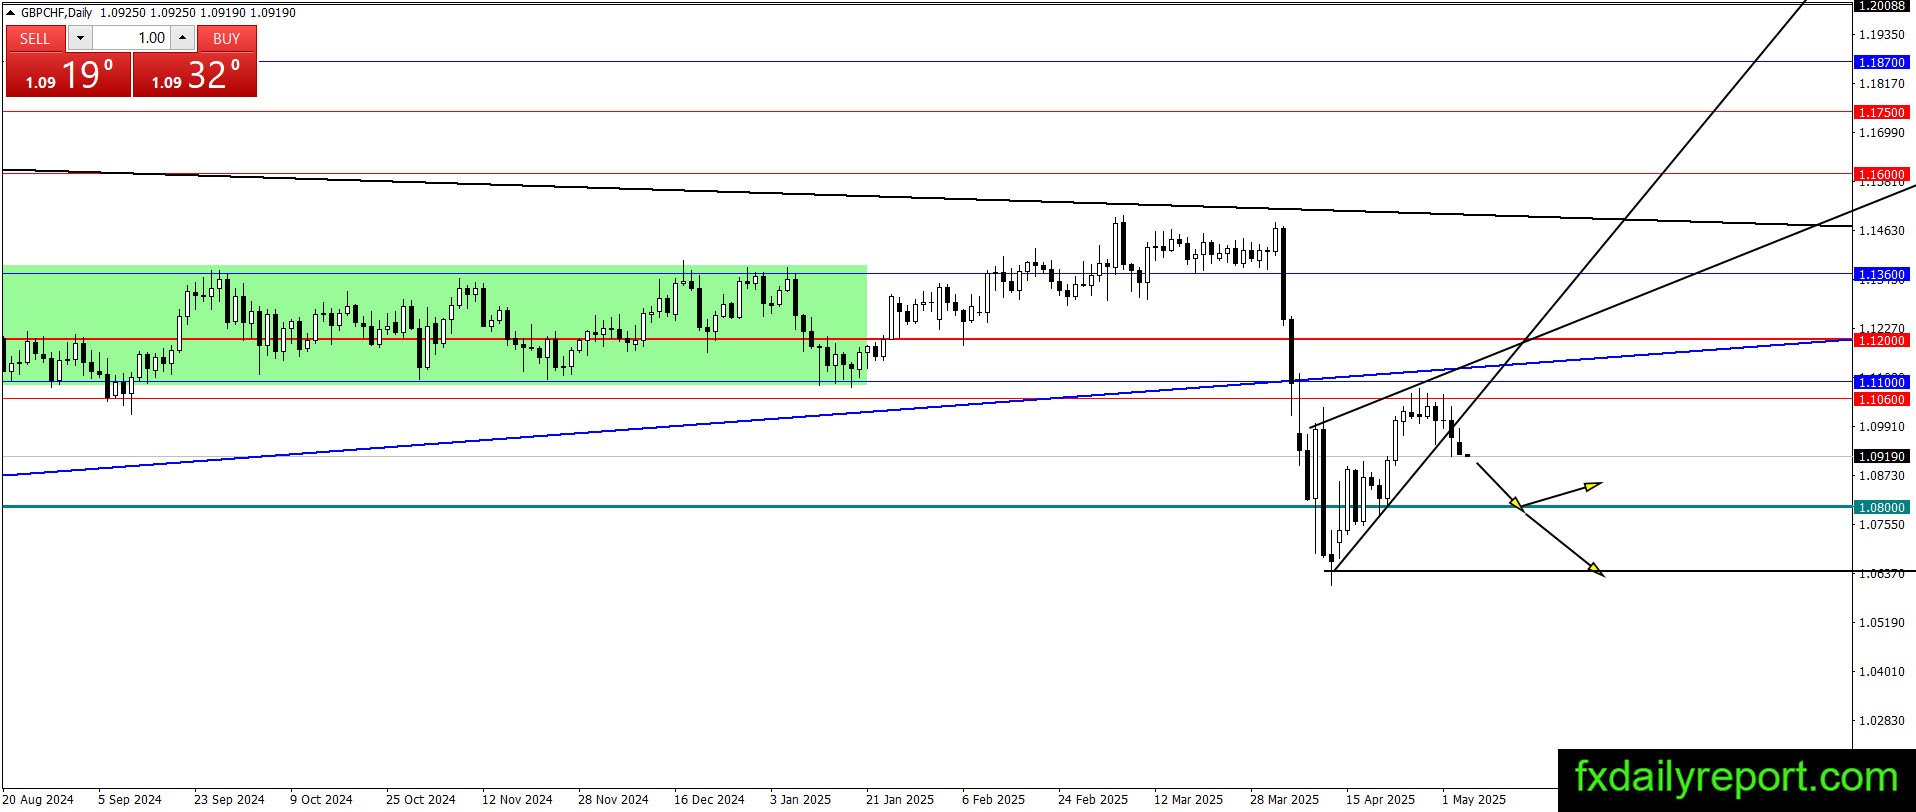
GBP/CHF continue the bearish movement and might resume the bearish trend to retest the 1.0800 level again. This week, the Fed FOMC meeting, might be the key on where the pair will move next. 1.0800 and 1.1100 will become the major levels to watch. If price could break out and close outside the levels, then traders will get confirmation on the next direction.
Today’s critical levels to watch:
Support: 1.0800, 1.0600, 1.0500
Resistance: 1.1000, 1.1200,