
USDX (USD Index)
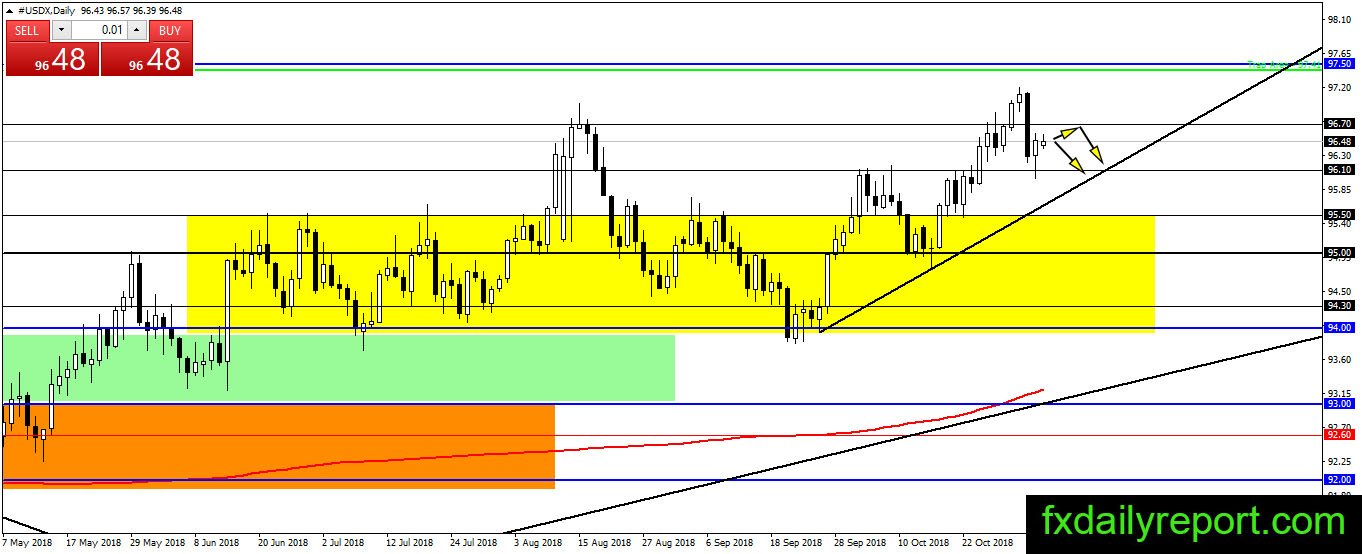
The index is on a pullback after printing fresh high and tested 96.10 in the previous week. There was a bullish bounce from the support level, however, Thursday bearish momentum candlestick is the one traders will watch. Overall, the U.S dollar index trends still bullish and it is important for the bear to hold the index below 96.70. A close above 96.70 could trigger rally and cancel weakness in the index.

We still expect the index to hit the black trend line. A close below 96.10 is needed for bearish continuation.
News to watch
10.00 AM U.S ISM Non-Manufacturing PMI, forecast reading of 59.3
For full outlook for this week, you can follow Forex Outlook For The Week 5 – 9 November 2018
Technical Analysis
EUR/USD
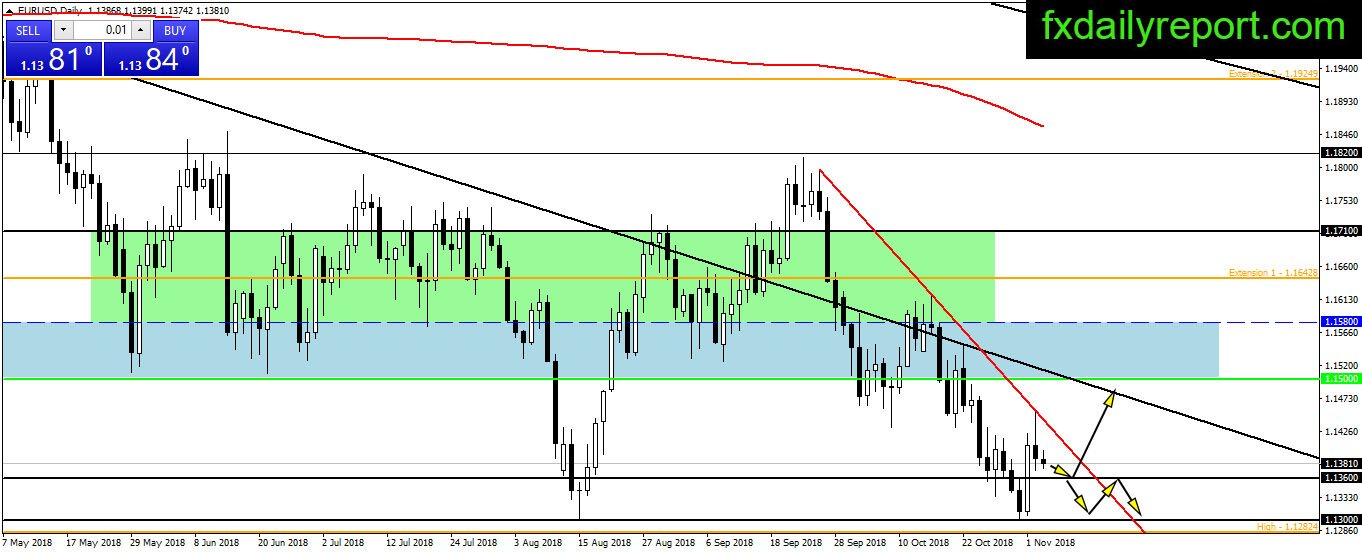
Sharp bounce from 1.1300 – 1.1360 area brought EUR/USD back above the area but the pair failed to print higher close above the bullish candlestick. At the current time, the pair lacks momentum and looking for a trigger for the next movement. If the pair moves down then traders could look for long position near 1.1360.
The bear still hold the advantage, as long as the trendline stay intact. However, we think EUR/USD will make correction at least toward 1.1500.
Today critical level to watch:
Support: 1.1360, 1.1300
Resistance: 1.1500, 1.1580, 1.1600, 1.1710
GBP/USD
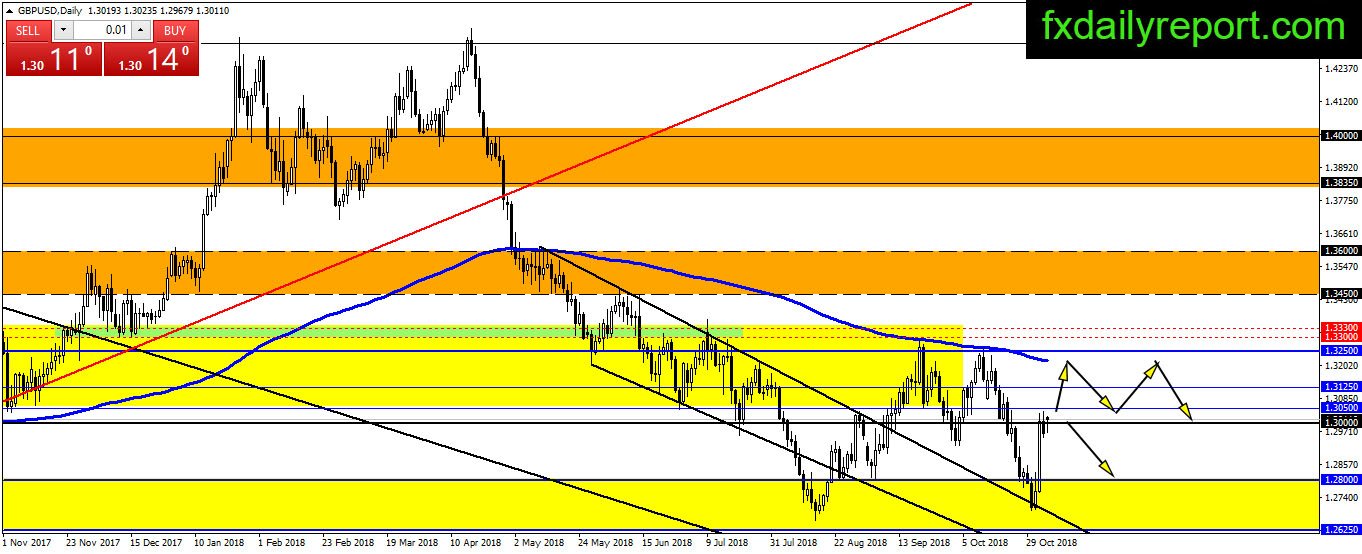
GBP/USD opened the week above 1.3000 and ready to climb after previous week bounce from below 1.2800. There is no follow through yet by the bull and the pair stick near 1.3000 the whole time. The overall trend is bearish which could give traders a chance to take a short position when GBP/USD failed to stay above 1.3000.
Meanwhile, a long position from 1.3000 with a tight stop below it might become the choice to take.
Today critical level to watch:
Support: 1.3000, 1.2800, 1.2625
Resistance: 1.3050
USD/JPY
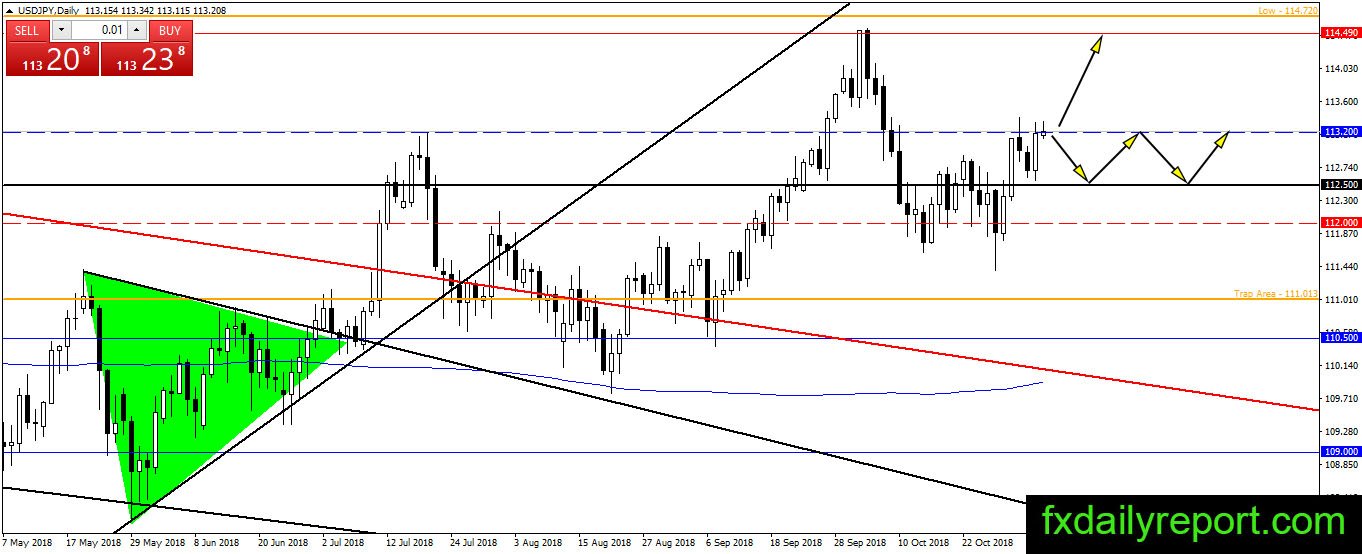
The pair bounced from a level near 112.50 and closed the week near 113.20 pressuring to the upside. There is no breakout happen yet and we expect USD/JPY to trade between 112.50 – 113.20 with an upside bias. Traders will monitor the daily close and take a position on the breakout.
Today critical level to watch:
Support: 113.00, 112.50, 112.00
Resistance: 113.20
AUD/USD
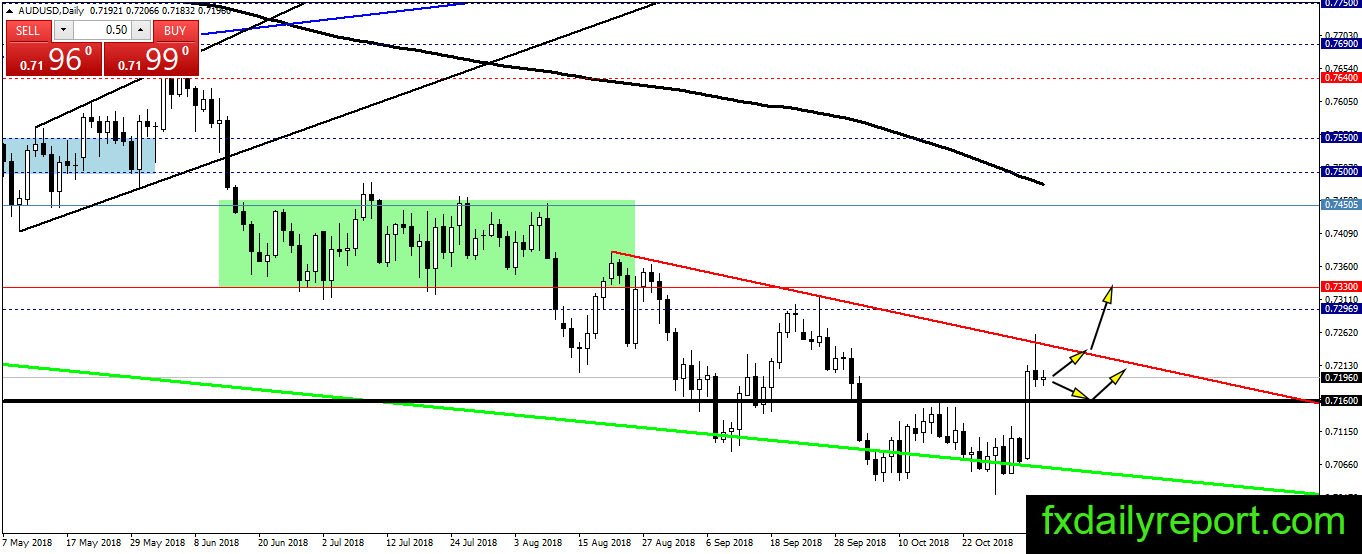
The red trendline on AUD/USD daily chart proven itself holding out against the bullish pressure. At the current time, the pair traded near its opening level and waiting for next movement. It could either a selling to test 0.7160 or another buying to test the trendline. We think the bull still has upper hand and could push AUD/USD higher toward 0.7300 – 0.7330.
Today critical level to watch:
Support: 0.7160, 0.7100, 0.7040, 0.7000
Resistance: 0.7300, 0.7330