
The Great Britain Pound (GBP) slid down against the US Dollar (USD) on Tuesday, decreasing the price of GBPUSD to less than 1.2800 following key economic releases. The technical bias may remain bearish because the pair’s price marked a higher low in the recent upside move.
GBP/USD Technical Analysis
Currently, the pair is being traded around 1.2759, a resistance can be noted around 1.2946, a support can be witnessed around 1.2641, the trendline support. Another support level may come at 1.2400, the psychological number. At 1.2106, the key horizontal support is likely to come across which may prevent the price of the pair from falling below this level as demonstrated in the given below chart.

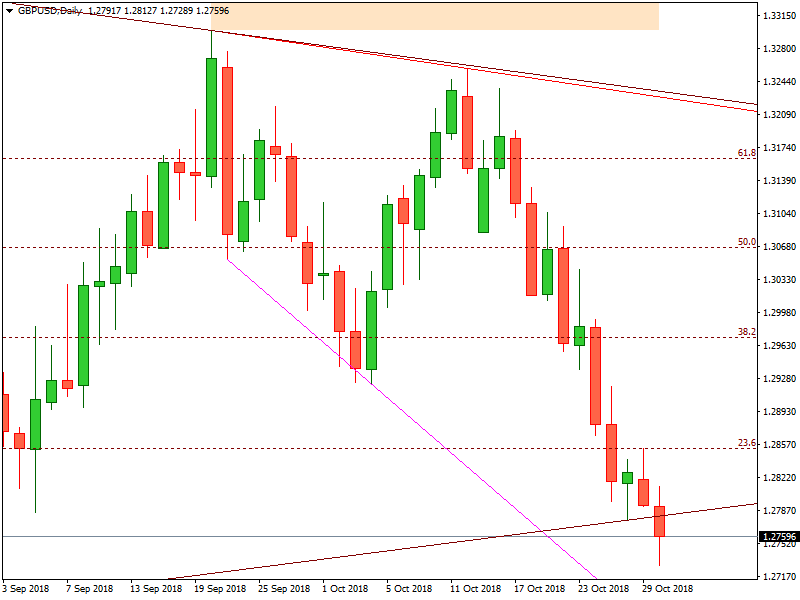
On the upside, 1.2973, the 61.8% Fib level resistance is the point of reference. Another resistance may come near 1.3237, the confluence of a trendline and a horizontal resistance level and then comes a key horizontal resistance around 1.3508, which is likely to resist the price from increasing further as demonstrated in the given below chart.
UK Growth
The UK economy picked up speed in the three months to July, boosted by warm weather and the World Cup.
The Office for National Statistics reported on Monday that GDP expanded by 0.3% in July, better than the 0.2% expected by City of London analysts and up from the 0.1% growth rate in June.
Over the three months, the growth rate picked up from 0.4 percent to 0.6 percent, the highest since the summer of 2017.
Generally speaking, a high reading in this regard is taken as a bullish trend for Great Britain Pound (GBP) whereas a low reading implies a bearish trend for the Great Britain Pound (GBP).
Trade Idea
Considering the overall price behavior of the pair over the last couple of days, selling the GBPUSD around current levels can be a good decision in short to medium term.