
GBP/USD long-term technical analysis
Brexit is the main topic to discuss in the UK especially when we are getting near to the March deadline. Today, PM Theresa May offered lawmakers options to do Brexit without a deal or to delay Brexit if her “Brexit deal” downvoted. Currently, parliament will vote on the Brexit deal on 12 March. UK Government noted the economy could weaken 9% if lawmaker chooses “No deal” on Brexit.
On the other side, U.S dollar index under pressure on dovish Fed. The central bank affirms there will not be rate-hike soon. The Fed chief Jerome Powell said they are concerned on the economic slowdown compared to previous year also monitor closely U.S-China trade war.

GBP/USD might have the highest uncertainties nearing Brexit, the pair could move wildly before and after the event. Traders might want to tread cautiously when taking positions in the pair.
New Month
Monthly chart
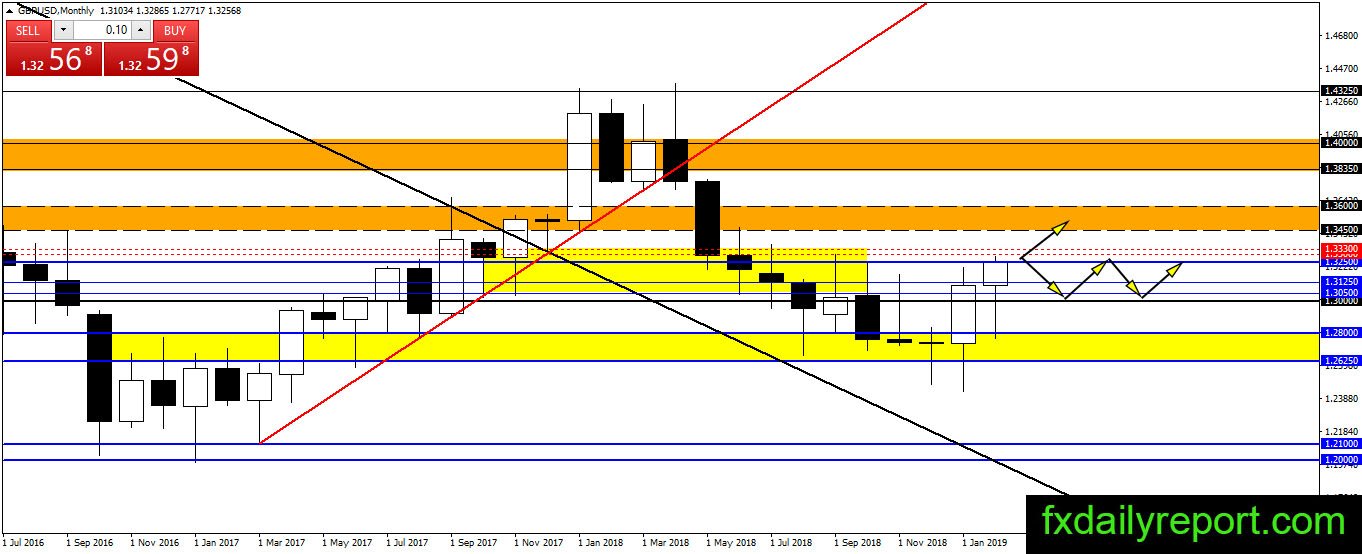
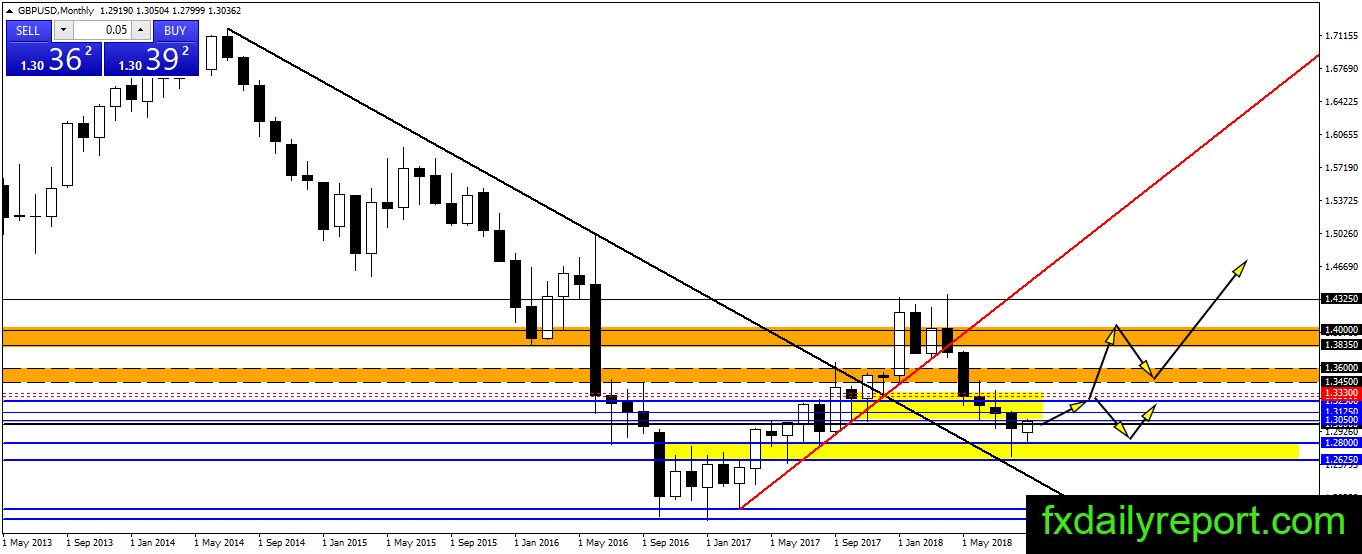
The downward movement of GBP/USD stalled when it hit the 1.2625 – 1.2800 area. Slowly the pair mustering the strength and bounce from the level. We have a bullish engulfing pattern on the monthly chart in January. The pair attempted to cancel the pattern by pushing GBP/USD to level below 1.2800 but the attempt failed and currently, GBP/USD has surpassed 1.3250.
Without any change in the current bullish momentum, it seems GBP/USD could continue further above 1.3300.
Weekly chart
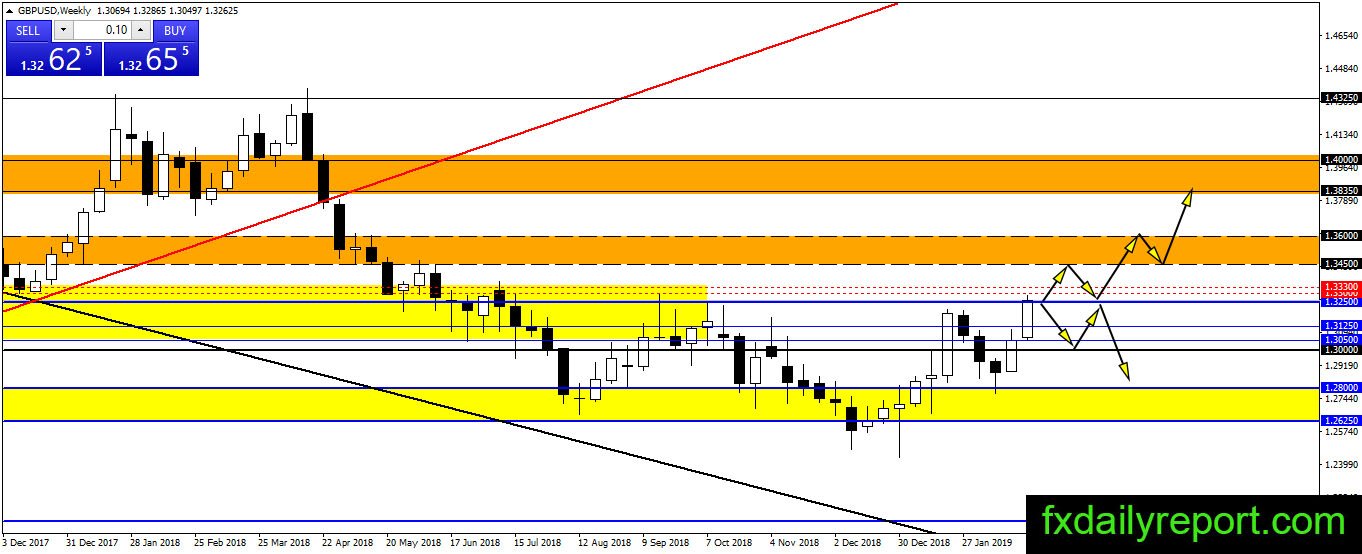
More bullish action seen on GBP/USD weekly chart. The pair is challenging 1.3250 resistance level and looks will make a breakout soon. On the upside, there are 1.3300 – 1.3330 and 1.3450 – 1.3600 areas to watch. Traders could consider short positions when there is a bearish reaction from both areas.
Daily chart
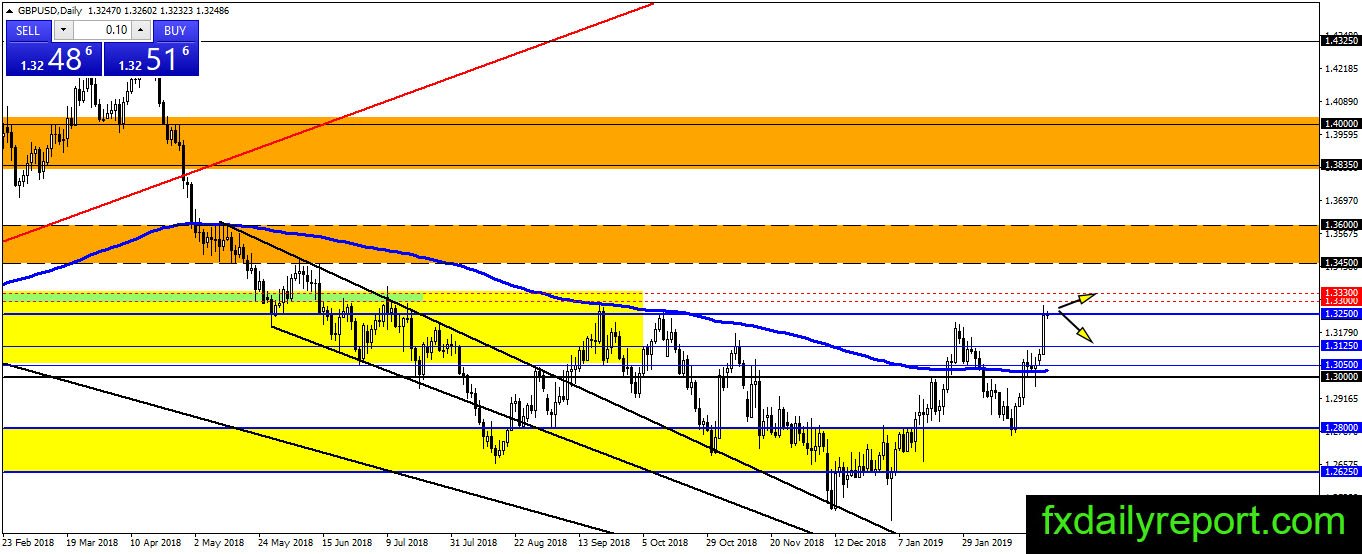
No strong reason to take short positions in GBP/USD at the current time. The pair shot higher from daily SMA 200 with strong momentum. It is currently testing 1.3250 and might easily break above it. Traders could continue to hold long positions, especially when there is closes above 1.3250.
Trade plan
The long position might need to wait until pullback happens. 1.3000 and daily SMA 200 are levels to watch. On the upside, a breakout above 1.3250 followed by retest might provide traders with long opportunities.
The short position is better avoided at the current time at least until the bullish momentum on daily chart receded. Traders could wait near 1.3300 – 1.3330 and 1.3450 – 1.3600 areas.