
On Thursday, the GBP/USD currency pair pulled back from the session highs of about 1.3258 to trade at about 1.3223. The currency pair trades within a descending channel formation on the 60-minute chart.
The pair continues to trade several levels below the 100-hour moving average line after the pullback. However, the currency pair bounced back to recover from the oversold levels of the 14-hour RSI.
GBP/USD Fundamentals Overview

From a fundamental perspective, the GBP/USD currency pair trades during a relatively busy period in both markets. In the UK, the preliminary S&P Global Composite PMI for September fell to 51.7, down from the previous month’s equivalent of 52.5.
On the other hand, the preliminary S&P Global Manufacturing PMI for the month rose to 52, up from 51.7 in August, beating the forecast reading of 51.4, while the preliminary S&P Global Services PMI for the period fell short of the forecast reading of 52, at 51.7, down from the preceding month’s equivalent of 52.5. Traders will be looking forward to the September consumer confidence index on Friday.
In the US, the preliminary S&P Global Composite PMI for September rose to 58.4, up from the previous month’s equivalent of 56. The preliminary S&P Global Manufacturing PMI also increased to 57, up from 53.9 in August, beating the forecast reading of 53.5.
On the other hand, the preliminary S&P Global Services PMI for the month outperformed the expectation of 56, with a reading of 58.7, up from the preceding month’s equivalent of 56.5. Traders will be waiting for the US initial jobless claims data later on Thursday, ahead of August durable goods data on Friday.
GBP/USD Technical Analysis (the 60-min Chart)
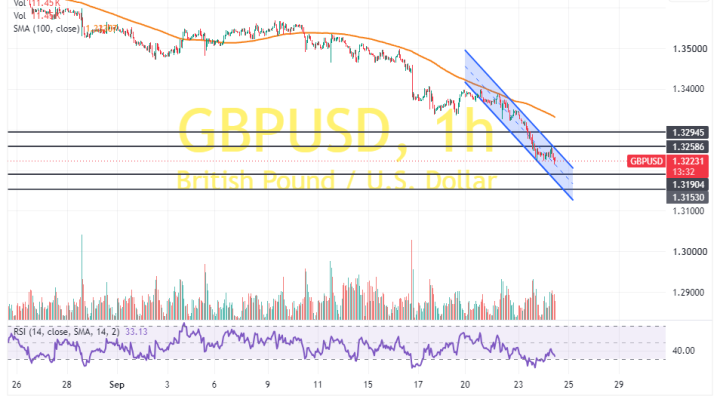
Technically, the GBP/USD currency pair trades within a descending channel formation on the 60-minute chart. However, the 14-hour RSI has recently bounced back to recover from oversold conditions.
Therefore, the bulls will look to extend the current rebound towards 1.3258 or higher, to 1.3294. On the other hand, the bears will look to pounce on profits at about 1.3190 or lower, at 1.3153.
GBP/USD Technical Analysis (the Daily Chart)
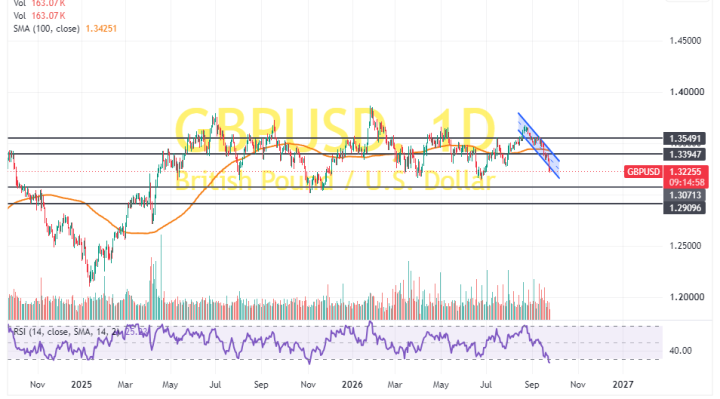
In the daily chart, the GBP/USD currency pair also trades within a descending channel formation. The 14-day RSI also supports a long-term bearish bias after falling into oversold conditions.
Therefore, the bears will look to extend the current pullback towards 1.3071 or lower, to 1.2909. On the other hand, the bulls will look to pounce on rebounds at about 1.3394 or higher, at 1.3549.