
GBP/USD is strongly bullish on the short term again after a false breakdown below a major dynamic support. Has found strong demand and now looks determined to climb towards new highs. USD drops versus the Cable as the dollar index extends the Friday’s sell-off.
It maintains a bullish perspective on the Daily chart, personally I believe that only the fundamental factors could force the rate to drop again. Technically should climb towards new peaks because has managed to stay in the green zone. The current decrease was natural, price has come back down only to recapture more directional energy before will try to climb much above the 1.3266 previous high.

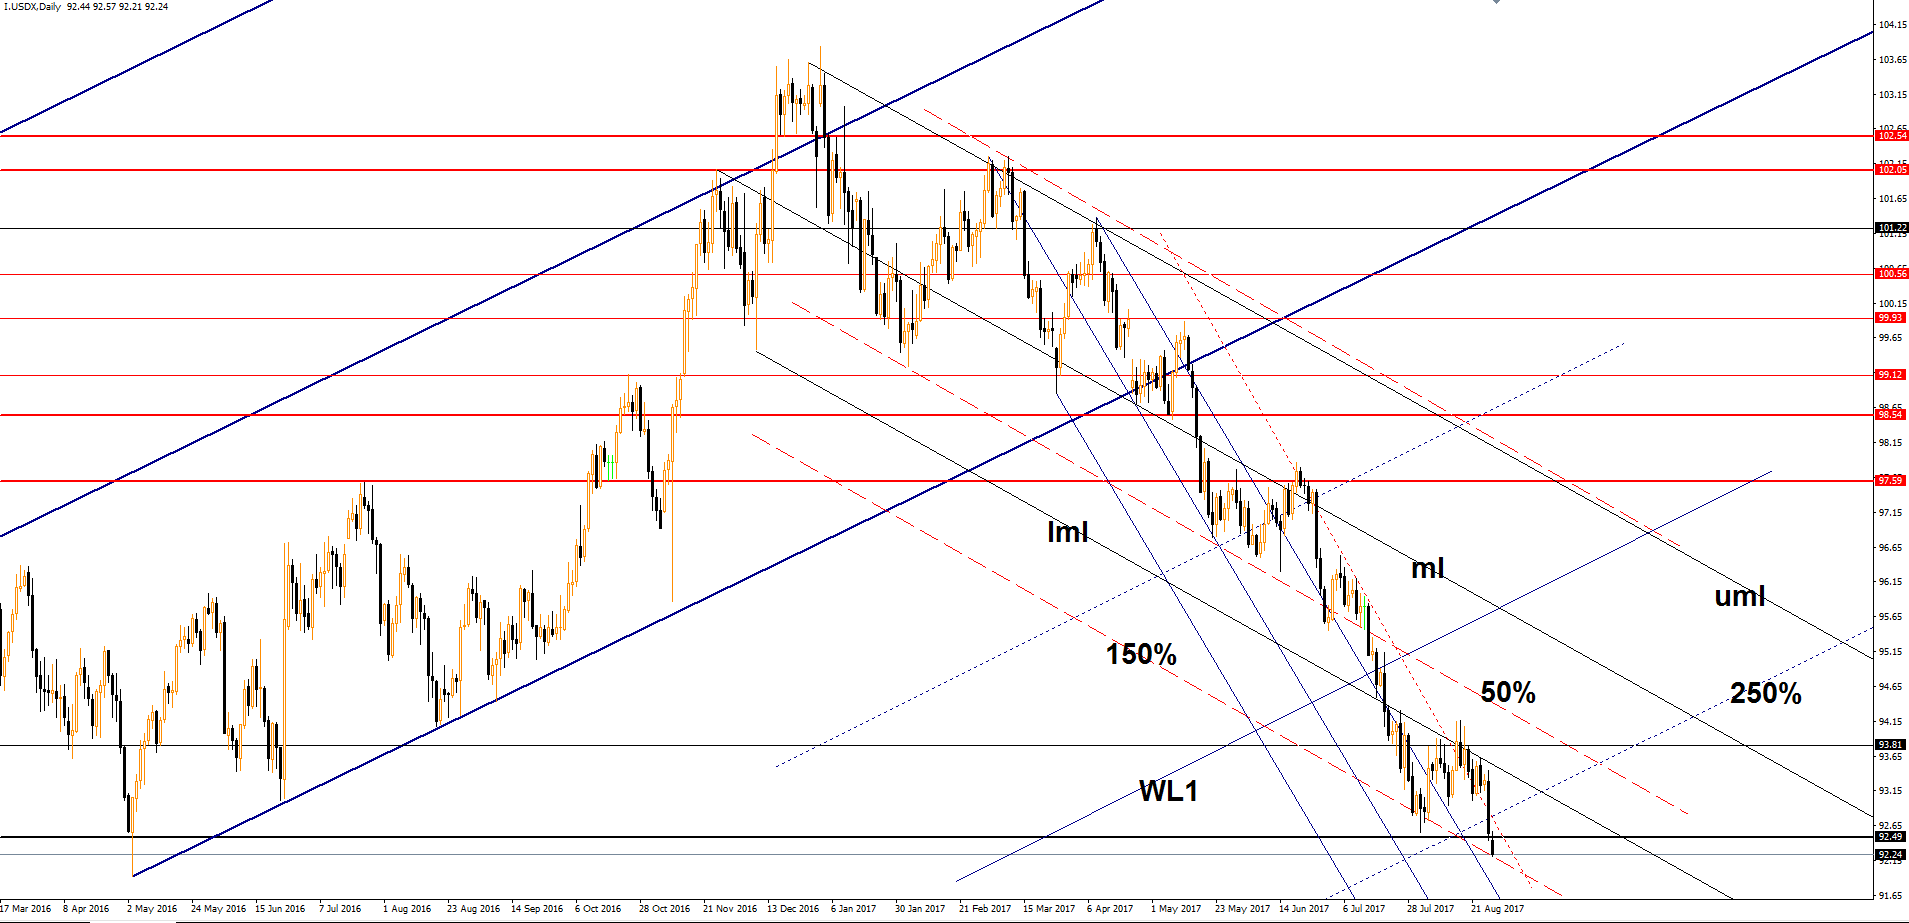
I’ve added the USDX’s chart to show you better why the USD is going down versus all its rivals. You can see that has plunged after the lower median line (lml) retest. Has dropped much below the 250% Fibonacci line (ascending dotted line), now is pressuring the 150% Fibonacci line (descending dotted line) of the descending pitchfork, only a rejection from here will signal another increase because a valid breakdown will confirm a further drop and a USD’s further decrease.
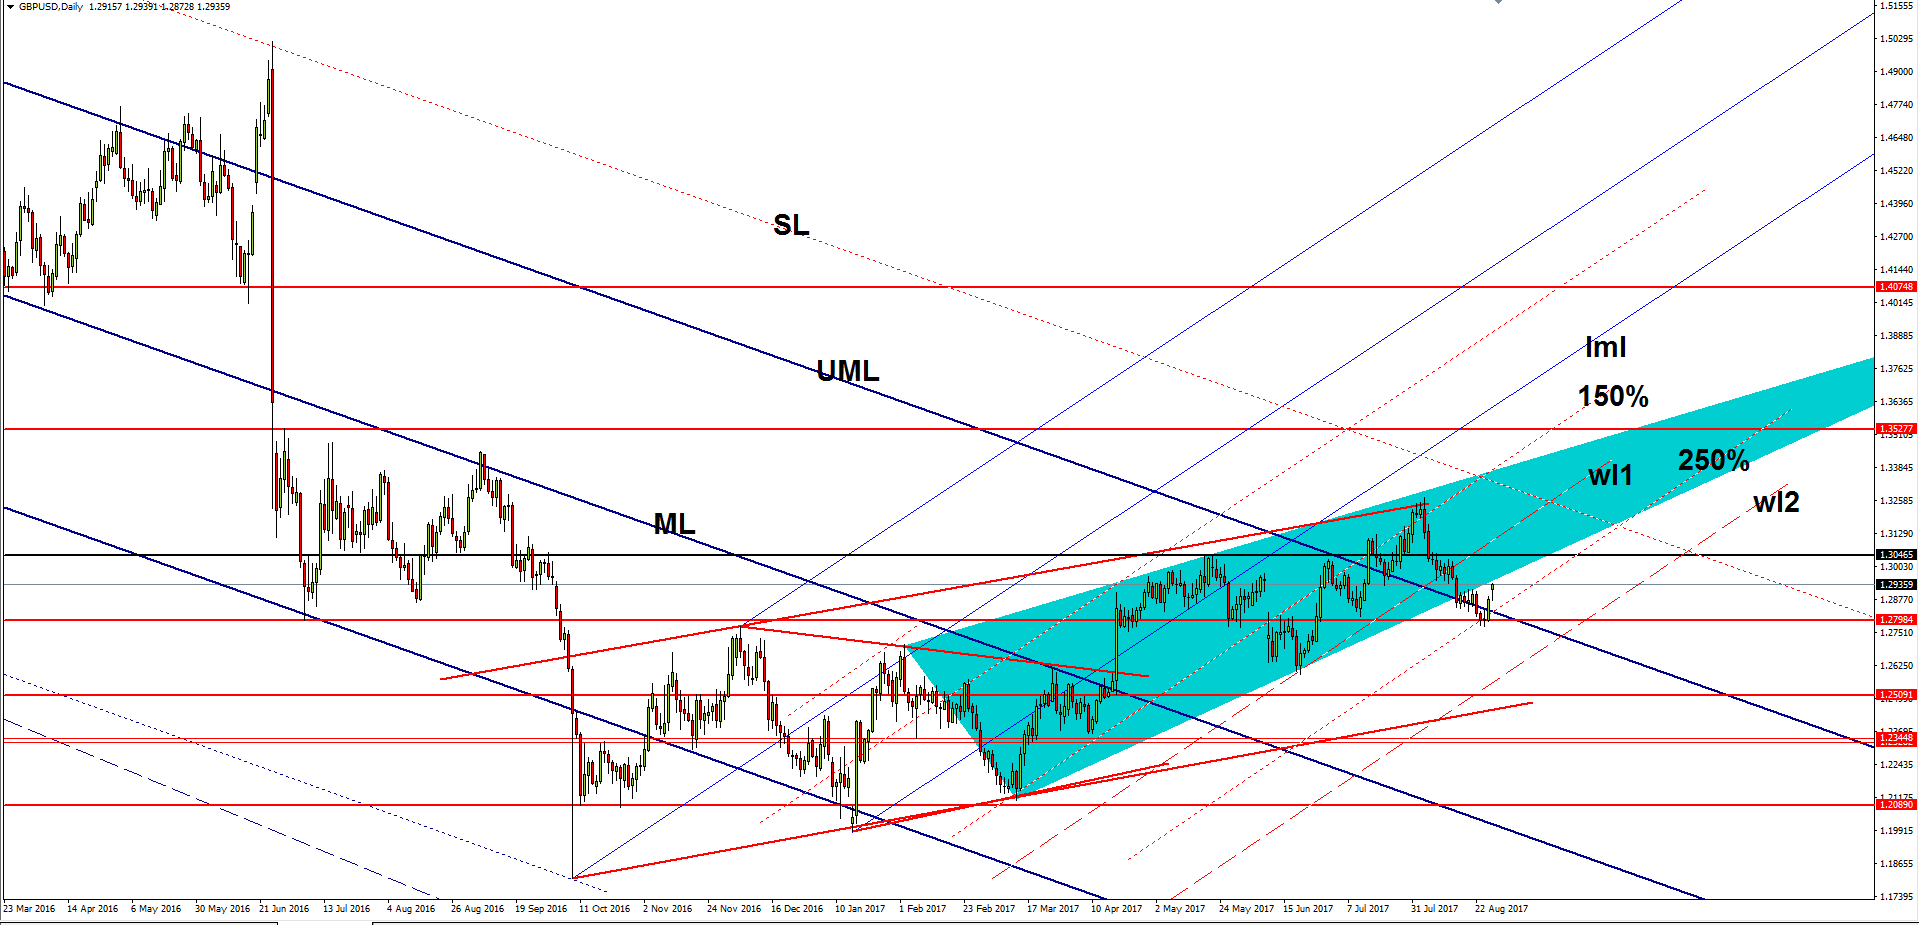
Price opened with a gap up in the morning, signaling that the Friday’s rally will resume. You can see that the rate has come back to close the gap, but failed to stay near the 1.2872 today’s low and now goes towards fresh new highs. The next upside target will be at the 1.3046 static resistance, we’ll see how will react when will touch it. The current increase is natural after the false breakdown below the upper median line (UML) of the major descending pitchfork and most important below the 1.2798 static support.
Is trading within the ascending channel’s body, has found strong demand somehow at the half of the pattern. The current increase could invalidate the Rising Wedge pattern, only a failure to close above the 1.3046 level will signal that the rate could still drop much deeper in the upcoming period.