
The gold price on Friday bounced off the key support at $1,700 after falling sharply on Thursday. The price of the yellow metal seems to be trading within a sideways channel formation in the 60-min chart.
The gold price has now fallen several levels below the 100-hour moving average line. However, Friday’s slight rebound continued to push it towards the centre of the 14-hour RSI.
Gold Price Fundamentals Overview

From a fundamental perspective, the yellow metal is trading at the back of a relatively busy period in the market. The gold price seems to be experiencing pressure from recent US data, which suggested the recession fears may be overblown. This week, US inflation rose by 9.1%, ahead of the consensus market expectation of 8.8%. Later on Friday, the preliminary Michigan Consumer Sentiment Index for July also came in stronger than expected with 51.1, versus 49.9.
On the other hand, the US retail sales control group for June returned a higher change of 0.8% compared to the forecasted change of 0.3%. General retail sales also impressed with a change of 1% (MoM) compared to the estimated change of 0.8%, while retail sales ex-autos beat 0.6% with 1% (MoM). On Thursday, the initial jobless claims data disappointed with 244k claims versus a forecast of 235k, while continuing claims impressed with 1.331 million versus an estimate of 1.383 million.
Gold Price Technical Analysis (the 60-min Chart)
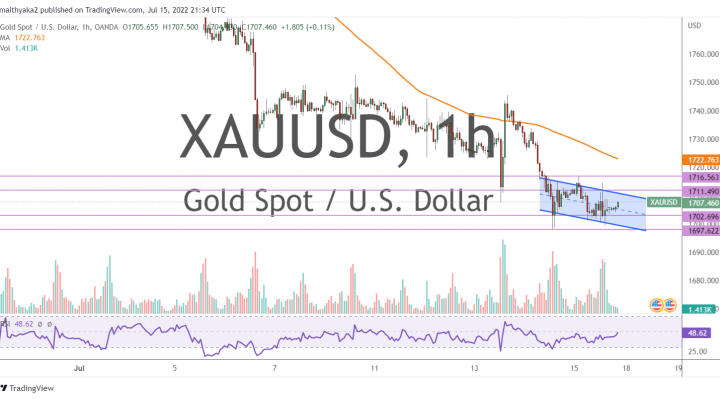
Technically, the gold price seems to be trading within a sideways channel formation in the 60-min chart. This indicates a lack of clear directional bias in the market sentiment.
Therefore, the bulls will be targeting potential upwards breakouts at about $1,711, or higher at $1,716. On the other hand, the bears will look to pounce on short-term profits at about $1,702, or lower at $1,697.
Gold Price Technical Analysis (the Daily Chart)
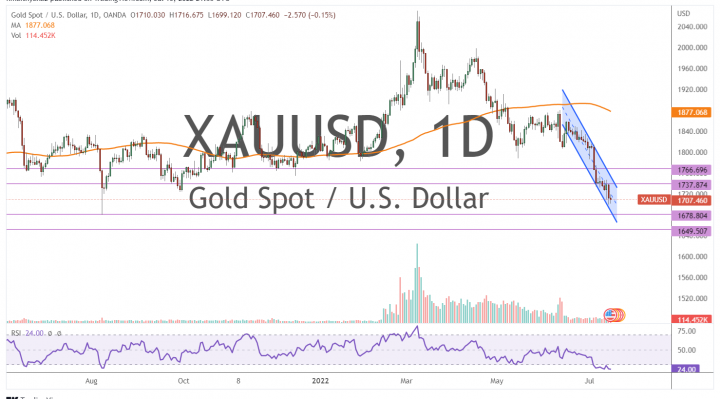
In the daily chart, the XAU/USD seems to be trading within a sharply descending channel formation. This indicates a significant long-term bearish bias in the market sentiment.
Therefore, the bears will be looking to extend the current declines towards $1,678 or lower to $1,649. On the other hand, the bulls will be targeting long-term profits at about $1,737, or higher at $1,766.