
On Friday, the gold price extended Thursday’s pullback from the current week’s highs of $4,146 to trade at about $4,067. XAU/USD trades within a descending channel formation on the 60-minute chart.
The price of the yellow metal continues to trade a few levels above the 100-hour moving average line, despite the pullback. As a result, it still has some room left to run before reaching the oversold levels of the 14-hour RSI.
Gold Price Fundamentals Overview

From a fundamental perspective, XAU/USD trades during a relatively busy period in the US market. On Friday, the US nonfarm payrolls for October outperformed the expectation of 65k, with a net job change of 165k, up from the previous month’s equivalent of 60k. The unemployment rate for the month also came in better than expected, at 4.1% versus a forecast of 4.2%, down from the previous month’s 4.2%.
The average hourly earnings for the period grew by 0.4% (MoM), beating the forecast change of 0.3%. The (YoY) equivalent was also stronger than expected, at 3.1% versus a forecast of 2.9%. Elsewhere, the preliminary Michigan Consumer Sentiment Index for November also exceeded the forecast reading of 48, with a reading of 51, up from 48 in October.
On Thursday, the US initial jobless claims for last week fell to 189k, down from 195k, and below the forecast of 196k. On the other hand, continuing claims for the preceding four weeks increased to 1.718 million, up from 1.695 million, and above the forecast claim count of 1.71 million.
On the other hand, the preliminary nonfarm productivity for Q3 outperformed the expected change of 2.5%, with a change of 3.6%, while unit labor costs for the period fell short of 0.6%, with a change of -0.7%.
Gold Price Technical Analysis (the 60-min Chart)
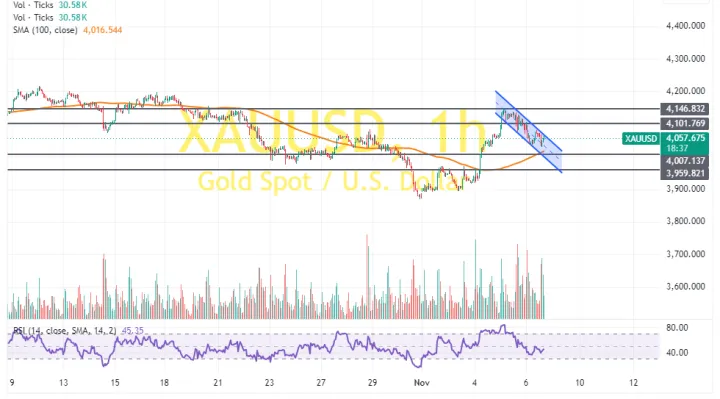
Technically, the gold price trades within a descending channel formation on the 60-minute chart. However, the 14-hour RSI still has some room left to run before reaching oversold conditions.
Therefore, the bears will look to extend the current decline towards $4,007 or lower, down to $3,959. On the other hand, the bulls will look to pounce on rebounds at about $4,101 or higher, up to $4,146.
Gold Price Technical Analysis (the Daily Chart)
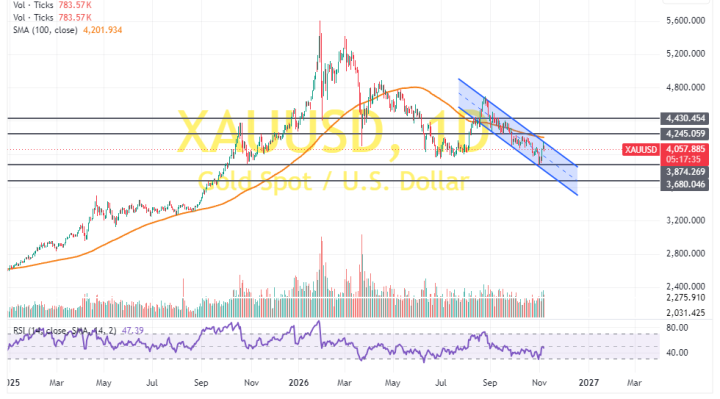
In the daily chart, the price of the yellow metal also trades within a descending channel formation. However, the 14-day RSI has recently bounced back to avoid falling into oversold conditions.
Therefore, the bulls will look to stretch the current rebound towards $4,245 or higher, up to $4,430. On the other hand, the bears will look to pounce on extended declines at about $3,874 or lower, down to $3,680.