
The price of gold on Thursday spiked to trade closer to the current weekly highs of about $1,870 before pulling back late on to settle at $1,840. The price of the yellow metal continues to oscillate within a highly volatile sideways channel in the 60-min chart.
The gold price has now dropped below the 100-hour and the 200-hour SMA lines. Thursday’s late pullback also prevented the price of gold from crossing to overbought levels of the 14-hour RSI. It has since pulled back to trade within the normal trading zone.
Gold Price Fundamentals Overview

From a fundamental perspective, the yellow metal is trading at the back of a relatively busy period in the US market. On Thursday, the preliminary US Q4 GDP showed an annualized change of 4% in line with expectations. This compares to the previous period of 33.4%. The (QoQ) change missed the expectation of 2.4% with a change of 1.9%. The preliminary personal expenditures prices for Q4 missed the expected (QoQ) change of 1.8% with 1.5%. Core personal expenditures for the same period also came short of 1.5% with 1.4%. The initial and continuing jobless claims outperformed the expectations of 875k and 5.054M, respectively with 847k and 4.771M.
On Wednesday, the US durable goods orders for December missed the expected change of 0.9% with a change of 0.2%. Nondefense capital goods orders for the period matched the expected change of 0.6% while durable goods orders ex-transportation outperformed 0.55 with 0.7%. The Federal Reserve Committee made the decision to keep the base interest rate unchanged at 0.25%.
Gold Price Technical Analysis (the 60-min Chart)
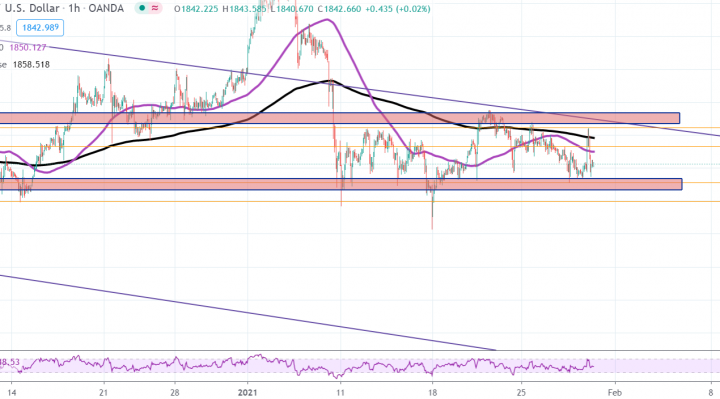
Technically, the price of gold appears to be trading within a highly volatile sideways channel formation in the 60-min chart. Gold has recently pulled back to avoid crossing to overbought levels of the 60-min chart.
The bulls will be looking to pounce for profits at around $1,853 or higher at $1,864. On the other hand, the bears will look to pounce for short-term pullbacks at around $1,831 or lower at $1,819.
Gold Price Technical Analysis (the Daily Chart)
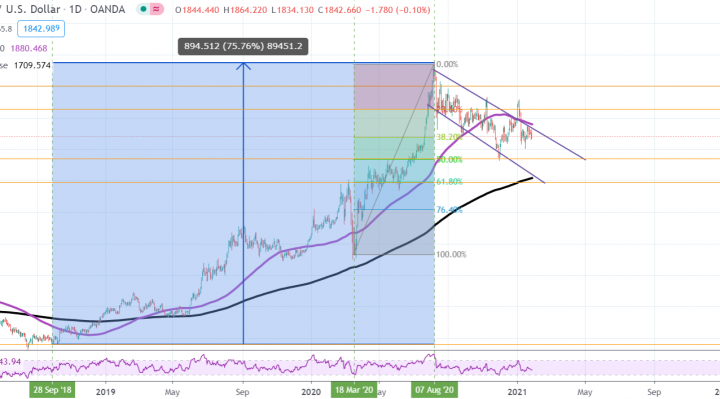
In the daily chart, the price of the yellow metal appears to be trading within a gently descending channel formation. It is now pinned around the 38.20% fib level on the way down.
The bears will be looking to extend the current bearish run towards 50% and 61.80% fib levels at $1,769 and $1,694, respectively. On the other hand, the bulls will target long-term profits at around the 23.60% fib level at $1,927 or higher at $2,002.