
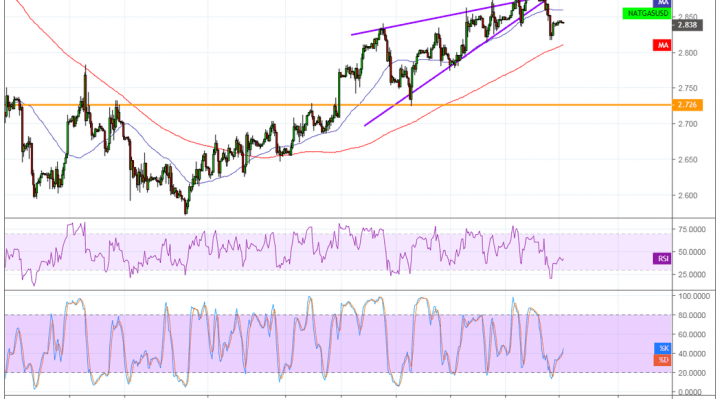
Natural gas broke below its short-term rising wedge consolidation pattern to signal that sellers have won over and could drag price down to the next support zone. This is located around the area of interest or former resistance turned support around $2.726.
The 100 SMA is still above the longer-term 200 SMA to indicate that the path of least resistance is to the upside. This suggests that support is more likely to hold than to break. Also note that the wedge spans $2.700 to around $2.900 in height so the resulting breakdown could be of the same size.

Still, the 200 SMA dynamic support close by might be enough to draw some bullish pressure. In that case, a bounce back to the highs or at least the broken wedge bottom could follow. RSI is pulling up from the oversold zone after all, indicating that bullish momentum is returning. The oscillator has plenty of room to climb before hitting the overbought region to signal exhaustion among buyers.
Stochastic is also turning higher to indicate that buyers are ready to return and keep the uptrend going. This oscillator has some ground to cover before reaching the overbought zone as well.
Natural gas previously drew support from forecasts of colder days in March, but it looks like demand for the heating commodity has yet to keep up with rising supply. However, forecasts now indicate that milder temperatures are due to sweep across the eastern US this coming weekend.
Still, there are expectations for colder temperatures in the regions east of the Rocky Mountains by March 16-20, so there is still scope for gains. Traders might now turn to data on stockpiles and output to gauge if a glut might still be a concern. This time, a draw might be reported, adding a bit more bullish pressure on prices.