
NKE Long-term outlook
New niche targeted by NKE in sportswear where its rival failed to spot the niche. NKE officially launched plus-sized athletic clothes and sports hijab for Muslim women. Both untouched markets go unchecked by Lululemon also Under Armour and will cost the company a big chunk of the market in the future.
The move toward this massive market which avoided by other retailers might give NKE wind to its sales and start a new trend in sporting apparels. Shares of NKE increase 8.05% in February from $52.90 to $57.16 and currently under correction before further upside move.

Click here to see NKE February analysis
New Month
Monthly chart
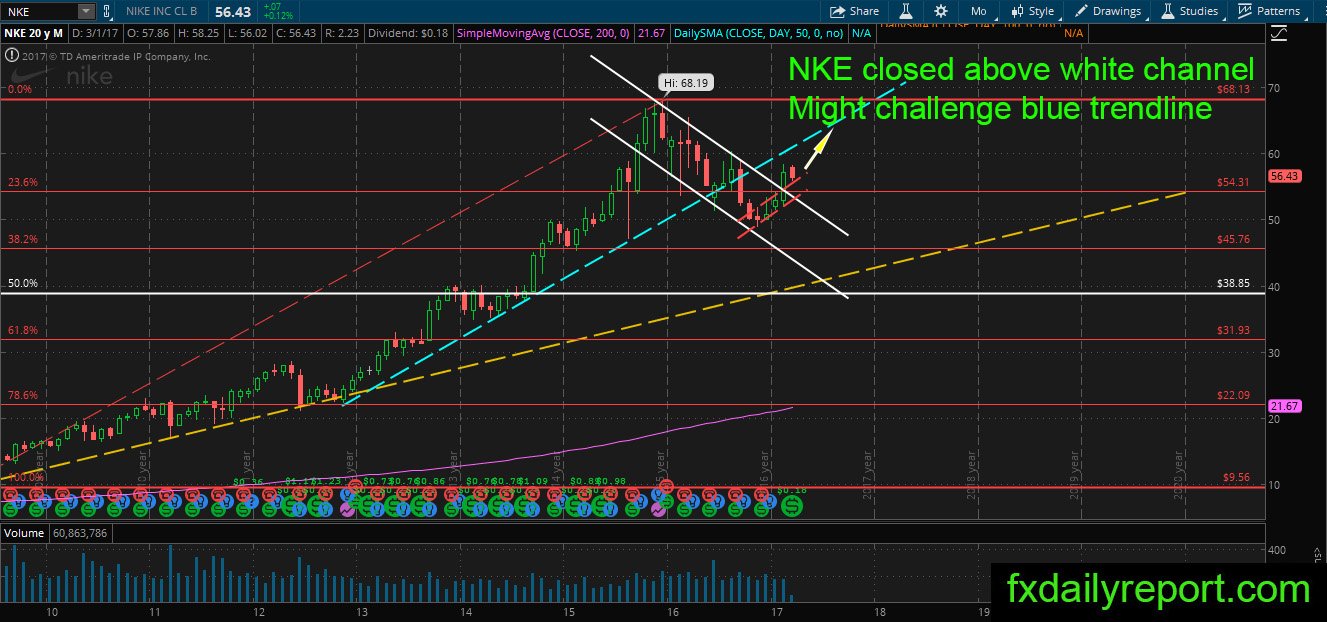
The monthly chart of NKE start to turn positive as the price close outside of its bearish channel, and it moves up. There is a chance for the share price to challenge blue trendline and close above it. Currently, the price is testing the broken red channel and might find support at $54.30.
Weekly chart
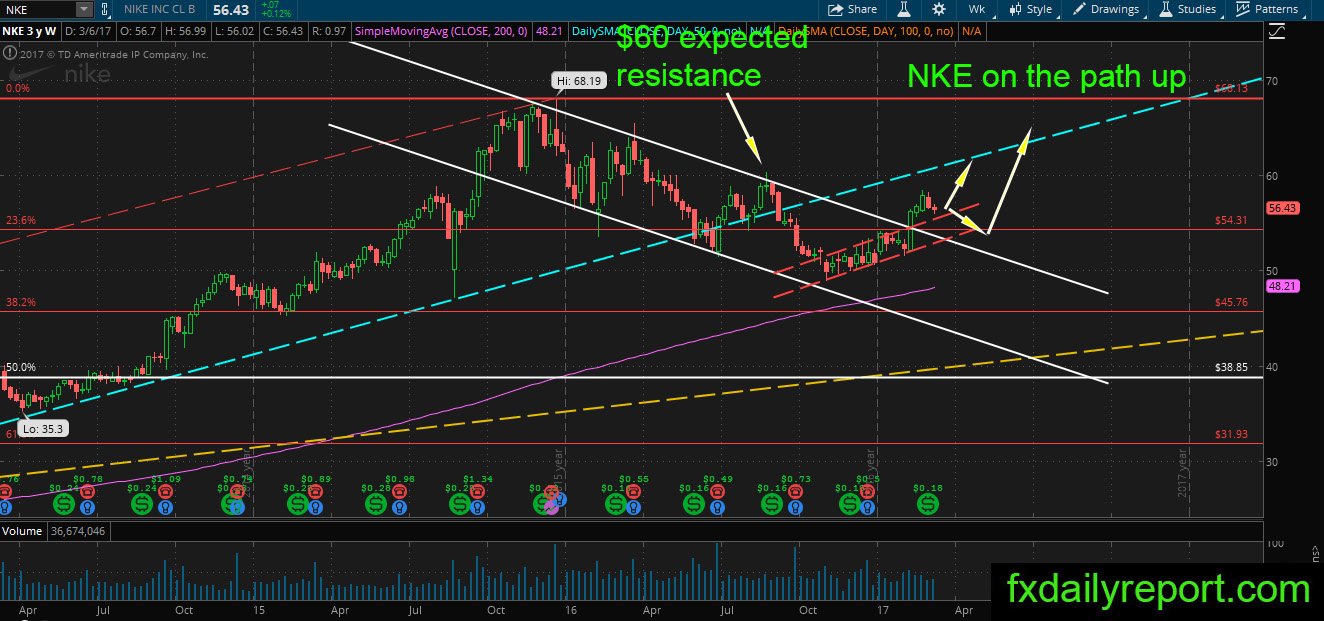
NKE is on the path upward after it broke above the bearish channel. The price formed bearish candlestick pattern “Bearish Harami” which might reverse the trend into bearish. If the price move down, $54.30 will act as support while on the upside there is blue trendline which shall serve as resistance.
Daily chart
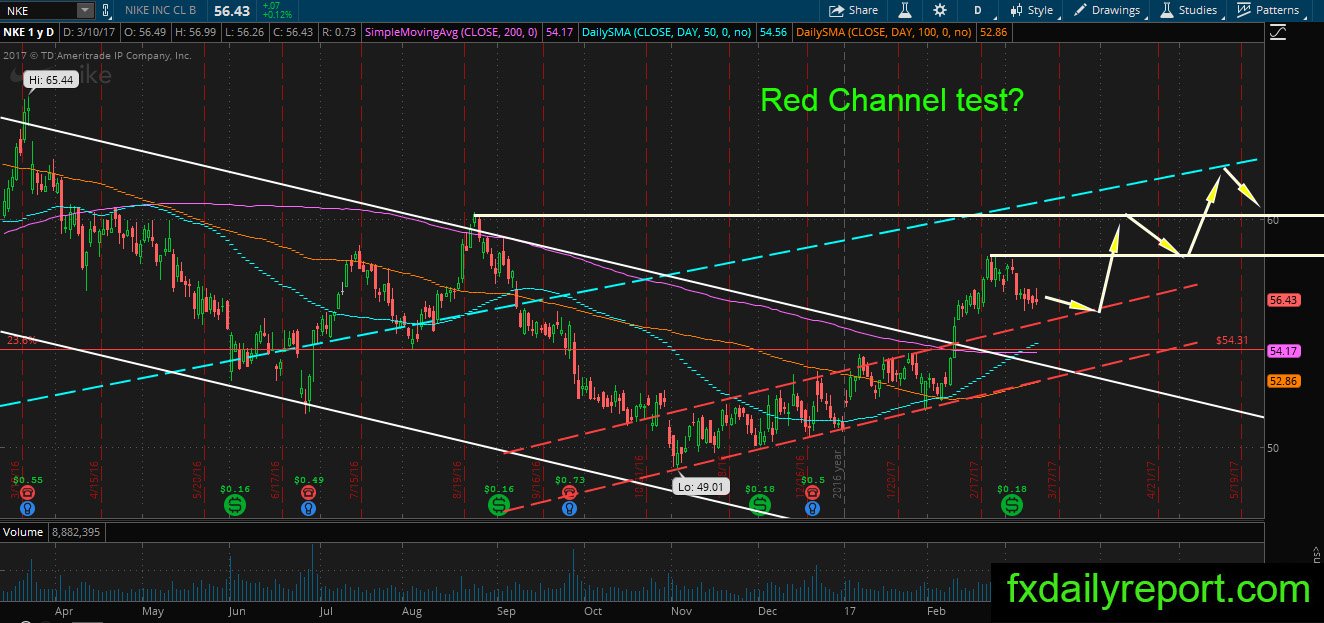
Resistance cleared on the daily chart, the price under correction and might touch the top of the red channel before continuing up. $58.40 is the nearest resistance the price need to surpass, and there is $60 handle which might hinder all upside movement and reverse the trend.
A good place to look for a long position is near the top of red channel followed by $54.3o major support.
Trade plan
The bullish position is best taken from $54.30 support and top of the red channel when tested.
Bearish position needs to wait until the price tested $60 or the blue trendline.