
NKE Long-term outlook
The arrest of Tiger Woods after driving under the influence (DUI) is something Nike need to consider right now. The trend of endorsement deals might be one of the promising deal which generates income for the company in the modern world. Nike might need to consider carefully upon the release of Woods result before terminating the contract. Earlier this month, Nike sign deal with Odell Beckham, Giant’s wide receiver. This is the biggest shoe deal to date and done in consideration to beat the competition.
Nevertheless, it is not the slowdown in sales and less revenue which is problematic for NKE. The company might need to protect itself from currencies instability in the futures. President Trump controversial policies, China new formula for Yuan, North Korea military tension, UK Brexit could change the whole picture of currencies strength which the company needs to take into account.

Click here to see NKE March analysis
New Month
Monthly chart

NKE on the monthly chart show a bullish sign after the price closed above its bearish channel the first time in January. The price is currently hovering near the broken channel and looking for support. If the price could bounce from the channel, it will start a new bullish sentiment in NKE.
Weekly chart
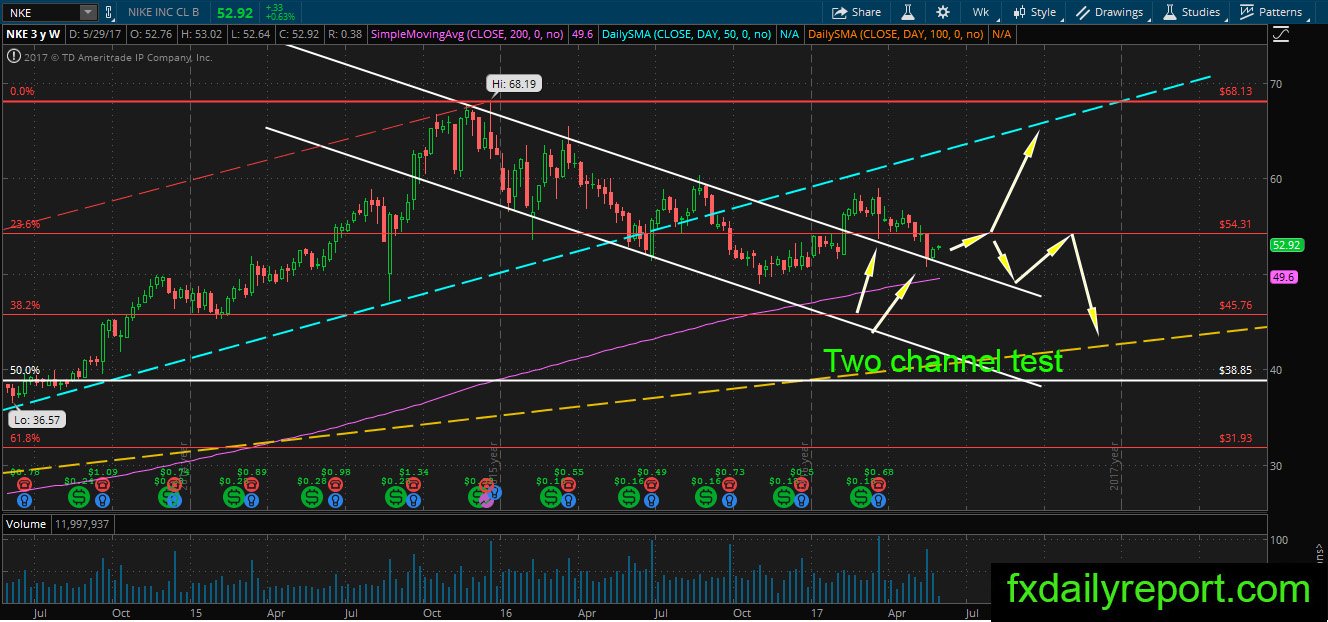
There is two channel test on the weekly chart of NKE. The first test show rejection but not enough to reverse the downward pressure. Another test happens in May, and the price quickly bounces on next week. The bounce is not strong enough to secure a new bullish leg, and it will depend on several weeks forward to determine the medium-term trend. The bull needs to bring the price higher than $54.31 to cancel the bearish candle break from the level.
Daily chart
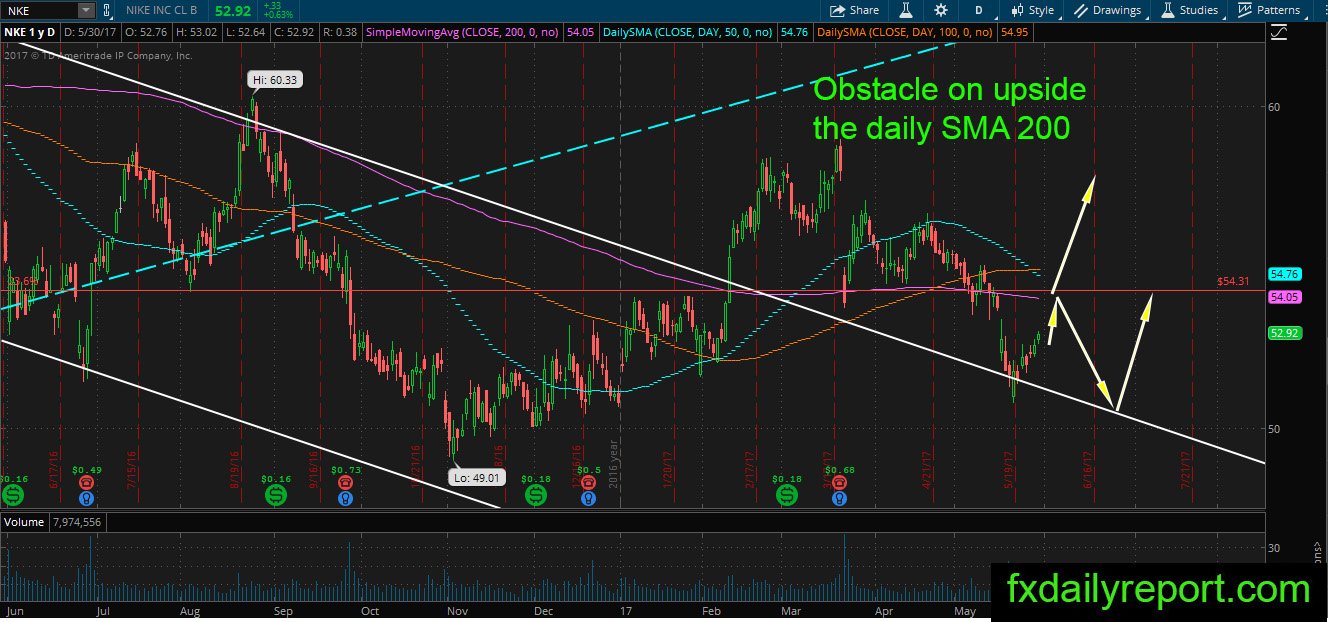
Outlook on the daily chart is optimistic after the bounce from the white channel. However, the bounce will soon face big obstacle at daily SMA 200. The price might be able to reach the averages, but there is the possibility it loses steam near it and reverses down.
Trade plan
The bullish position needs to wait until a break above daily SMA 200 and bounce higher from it.
Bearish traders could position themselves near the daily SMA 200 and wait for the bearish pattern.