
NZD/USD long-term technical analysis
NZD/USD started its bearish movement again in January after the bearish rejection from 0.6680 resistance. The pair has moved below January low this month. No reason to become bullish in the pair yet. Traders and investors mostly concerned about global economic growth after hit by the coronavirus in December last year.
If China could not solve the coronavirus issue by March it might incite further uncertainties in the world and push more countries into recession.
New Month
Monthly chart


NZD/USD resumes its bearish movement, following the bearish trendline until it reaches the bullish trendline. It managed to bounce from the bullish trendline and breakout above the bearish trendline. However, the bullish pressure losing momentum and currently the pair has traded below the bearish trendline again.
It seems the pair will make another test on the bullish trendline and might break below it.
Weekly chart

The yellow and orange area were broken downside in the past. NZD/USD always rejected from the orange area when its attempts to move higher. Currently, the pair is moving lower and will target the bottom trendline. If a breakout below the trendline happens then NZD/USD will continue its long-term bearish trend.
Daily chart
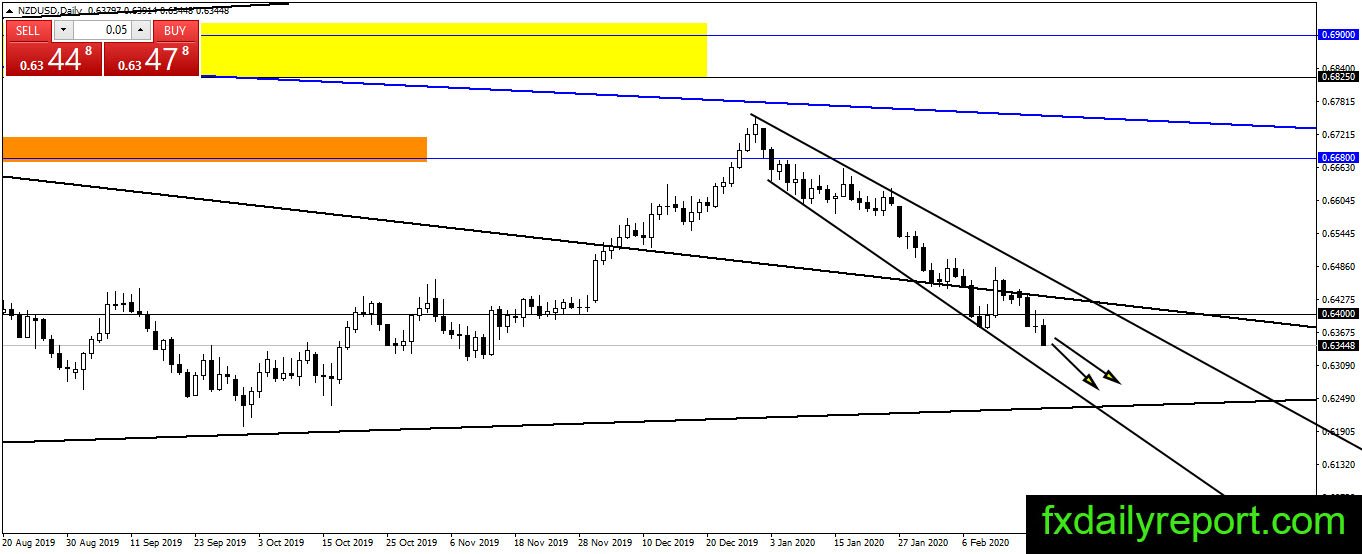
NZD/USD is on track lower and no change to the bearish sentiment yet. The pair currently trades inside the trendline range and will target the bullish trendline below. The level around 0.6250 might become the support level to watch.
Trade plan
The long position could be when there is a major bullish pattern on the daily or weekly chart. For the safest option, it is better to wait until the monthly chart shows a bullish reaction.
Short positions could be taken when NZD/USD make a bullish correction. 0.6400 is the nearest level to watch.