
PG Long-term outlook

PG has reached a new record high in September, and the share prices stalled at high before fell in October. The share prices declined 5.1% in October from $90.98 to $86.34 and might continue in later months. In November, the company experienced buying which caused by new CEO election. News said, Nelson Peltz, the activist investor is the highest contender for the position.

If Peltz elected as CEO, PG might undergo radical structuring. Peltz’s Trian Fund Management mentioned the plan to divide company business into three standalone business. The three standalone businesses are grooming, home care, and family care. It will be interesting to see how PG develop in the future when new CEO enters the office.
New Month
Monthly chart

PG on the monthly chart made the second test to a level around $94.00 and formed a possible double top pattern. The test followed by a bearish engulfing pattern in the previous month. There is no confirmation break of the bearish engulfing pattern yet which is “safe” to assume the selling pressure has stopped.
Currently, the share prices moving up and erase 50% losses incurred in the previous month. If the bull could further push the price higher and retrace 60-70% of the losses, it might open chance to test record high.
Weekly chart
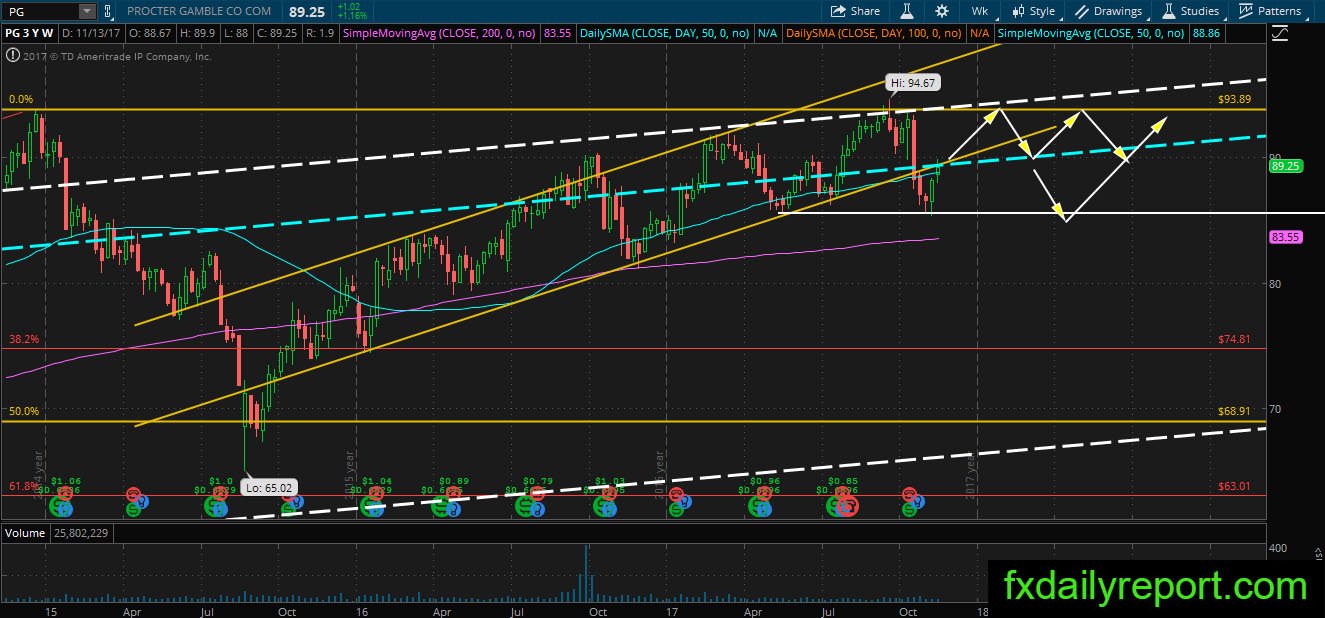
Possible range established between $85.00 – $94.00 on PG weekly chart. The share prices are currently testing broken channel from below. Will the bull manage to close the price inside the channel again?
Daily chart

Although the monthly chart of PG shows positive development, the trend on the daily chart is bearish and should raise the alarm for traders. The share prices fell below daily SMA 200 and currently testing it from below. Most of the time the market will follow the direction of initial breakout and traders could use this opportunity to look for a short position.
Trade plan
A long position might need to wait until the share prices recover more on the daily chart. A close above daily SMA 200 is needed before placing position.
A short position could be taken daily SMA 200.